Download
1 / 21
210 likes | 375 Vues
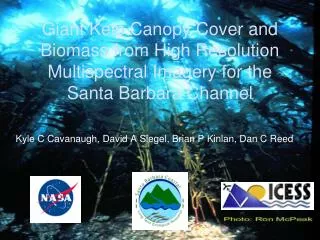
Giant Kelp Canopy Cover and Biomass from High Resolution Multispectral Imagery for the Santa Barbara Channel. Kyle C Cavanaugh, David A Siegel, Brian P Kinlan, Dan C Reed. Macrocystis pyrifera. High economic and ecologic importance “ecosystem engineer” Kelp abundance highly dynamic

E N D
Giant Kelp Canopy Cover and Biomass from High Resolution Multispectral Imagery for the Santa Barbara Channel Kyle C Cavanaugh, David A Siegel, Brian P Kinlan, Dan C Reed
Macrocystis pyrifera • High economic and ecologic importance • “ecosystem engineer” • Kelp abundance highly dynamic • Growth rates up to 0.5 m/day • Avg. frond life: 3-5 months • Ave. plant life: 2-3 years
Macrocystis growth and mortality • Growth and mortality regulated by water temp, nutrients, depth, bottom type, predation, wave action • Nice model system for studying the role of disturbance in regulating ecosystems Kelp biomass data from Kelco visual estimates; Fish observations from Brooks et al 2002
Previous SB Channel surveys • Aerial visual canopy biomass estimates by ISP Alginates (monthly from 1958-2005; entire coast) • CDFG 2m resolution aerial surveys using NIR imagery (annual from 2002-present; entire coast) • LTER SCUBA transects (monthly for 3 SBC kelp beds from 2002-present) • Scale issues…
Research goals • Expand spatial and temporal resolution of kelp canopy cover and biomass datasets using high resolution satellite imagery • Use this data to model kelp population dynamics in relation to patch size, connectivity, and biophysical forcing
Remote Sensing of Macrocystis • Surface canopy of giant kelp exhibits typical vegetation spectral signature (red-edge) • Low red reflectance • high near infrared (NIR) reflectance • Canopy biomass well correlated to entire forest biomass (r2 = 0.92)
SPOT Imagery • Well suited to differentiate kelp • Spectral bands in the green, red, NIR, SWIR • 10 m resolution
SPOT Imagery Datasets • Canopy Cover • Biomass
Methods: Canopy Cover • Principal components analysis calculated for kelp habitat (0-60 m depths) PC band 1 • Positive contribution from all 3 bands • Glint, sediment loads, atmosphere variations, etc. False color SPOT image (8/15/2006) PC band 2 • High NIR, low green and red reflectance • Kelp
Methods: Canopy Cover Classification • Minimum kelp threshold value selected from 99.9th%-tile value of offshore (35-60 m) pixels
Validation: Canopy Cover • Cover measurements compared with high resolution 2004 CDFG aerial kelp survey SPOT: Oct 29, 2004 CDFG: Sept-Nov 2004 r2 = 0.98 p < 1*10-7
Biomass Data • More useful for understanding and modeling ecosystem interactions • Turnover rates, export, NPP, etc. • Difficult to measure directly • Time and effort intensive
SBC-LTER SCUBA Measurements of Frond Density and Biomass • Monthly SCUBA measurements of frond density and biomass made at Arroyo Quemado (AQUE), Arroyo Burro (ABUR), and Mohawk (MOHK) kelp beds. • Limited spatial scale
Seasonal kelp biomass changes along 3 LTER transects • Maximums in late 2002 • Wave driven seasonality apparent
Methods: Biomass • Normalized Difference Vegetation Index (NDVI) (NIR-RED) (NIR+RED) • Calculated for areas of kelp cover NDVI Transform
Validation: Biomass r2 = 0.71 p < 1*10-7 y = 14.33x - 0.13 r2 = 0.54 p < 1*10-7
Comparison of SPOT vs. Kelco Biomass Data r2 = 0.73 p < 1*10-7
Population Dynamics Modeling • Persistence, extinction, and biomass changes of kelp patches as a function of size, connectivity, and biophysical factors • High spatial resolution kelp maps will allow us to include effects of sea temperature, nutrients, wave energy, substrate, light attenuation, spore production and dispersal