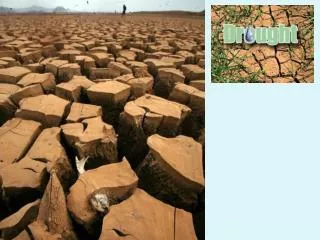
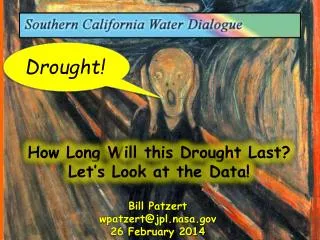
Drought!
Drought!. How Long W ill this Drought Last? Let’s Look at the Data!. Bill Patzert wpatzert@jpl.nasa.gov 26 February 2014. January 18, 2014. January 18, 2013. Record Drought in 2013-2014 • L.A. (CA) Calendar Year 2013 - Jan – Dec = 3.60” - Driest in 135 yrs

Drought!
E N D
Presentation Transcript
Drought! How Long Will this Drought Last? Let’s Look at the Data! Bill Patzert wpatzert@jpl.nasa.gov 26 February 2014
January 18, 2014 January 18, 2013
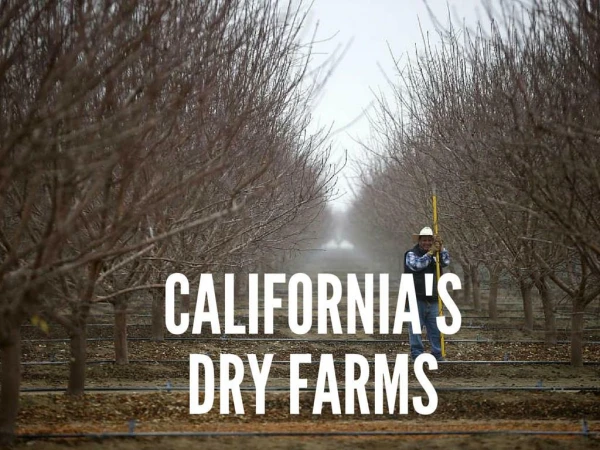
Record Drought in 2013-2014 • L.A. (CA) Calendar Year 2013 - Jan – Dec = 3.60” - Driest in 135 yrs • CA Water/Snow Year 2013 – 2014 - L.A. = 1.20” (~12% of norm, 10.72”) • Most of West in 3+ year drought • Drought started in 1999? - 11 of last 15 years below normal
L.A. Resident, MWD Customer
Why? Pacific Decadal Oscillation & Drought Strongly Modulates: • Precipitation/Snow • Water Supply • Global Temperature • Land & Ocean Ecosystems
The Pacific Decadal OscillationSea Surface Temperature Pattern Warms Pacific (Earth) Cools Pacific (Earth)
California Precipitation •No Trend! • Highly variable - 38.32” wettest yr (2006–2007) - 3.21” driest yr (2004–2005) - 11 of past 16 yrs below ‘normal’ • Strongly Modulated by: - ‘Events’ (Atmospheric River, 30-70%) - Interannual (El Niño, La Niña & La Nada) - Decadal (Pacific Decadal Oscillation)
December 2010 ‘Atmospheric River’ Event Heavy Winter Rains (50% Annual Rain) 13 Wet, Cold Days last two weeks of December ‘10 14.40”at JPL (2.86” normal) Accounts for 30 to 70% Of Our Rain & Snow!
El Niño Positive PDO La Niña Negative PDO
Winter 2013–2014 Jet Stream Pattern
California Rainfall ‘No’ Trends 1925-2007From NoCal (left) to SoCal (right)
Sacramento & Los Angeles Rainfall (1878 – 2004) (Yearly, 10 Year Running Mean & Trend) If trend is 2.5 cm (1”)/century and variability is similar, trend is significant in ~270 years!
Positive PDO - 1983 Negative PDO - 2014 The Pacific Decadal Oscillation
Global Temperature • Global is Warming (Trend is 0.012°F/yr.) - CO2 increased from 280 to 400 ppm • Strongly Modulated by: - ‘Events’ (Weather) - Interannual (El Niño, La Niña & La Nada) - Decadal (Pacific Decadal Oscillation) - PDO Phase Shift causes ‘GW Hiatus’ or ‘GW Acceleration’
0.012°F/yr. -PDO +PDO -PDO
Global Annual Temperature Anomalies vs 1951–1980 Average (°C)* ENSO Modulates Global Temps *NASA’s Goddard Institute for Space Studies (GISS)
Global Temperature Anomalies since 1950 Pacific Decadal Oscillation Modulates Global Temperatures Positive PDO = Rapid Increase Negative PDO = Recent Hiatus Negative PDO = Hiatus
WhyDrought? Pacific Decadal Oscillation Strongly Modulates: • Precipitation/Snow • Water Supply • Global Temperatures • Lots of Other Stuff When Does Drounght End?
Fracking = H2O Since 2005, 250 billion gallons H2O used in 80,000 wells in 17 States!
CA Population Explosion Stresses Everything! 6X 4X 2X
L.A.-1902 It’s us! L.A.-2010
Managing Water in Semi-Arid CA • (Naturally) Varying Climate • Global Warming Accelerating • Environment Stressed Out • Expanding Agricultural Demands • Growing Urban Population • Changing Economy • Technology Explosion • New Users (Frackers)
Our water management policy is tailored for more wet years than dry years. The reality is just the opposite. Even when nature behaves, there are too many water demands to satisfy all of them. This drought is a great opportunity to start a real conversation about fundamental changes in California water policy
Ignoring Reality = Dire Consequences What’s your worst nightmare? • Politicians • Lawyers
The Great Flood of 1938 76th Anniversary February 27 – March 4, 1938 ~10.0” of Rain