Download
1 / 1
10 likes | 88 Vues
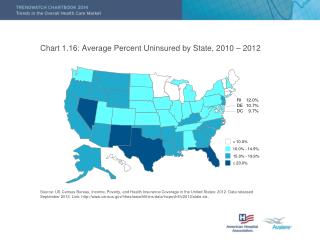
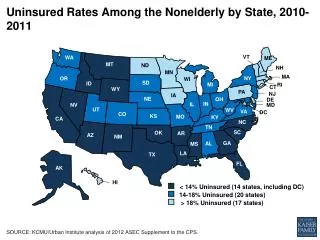
Analysis of uninsured rates among nonelderly individuals in different U.S. states in 2010-2011, categorized by percentage brackets. Data source: KCMU/Urban Institute.

E N D
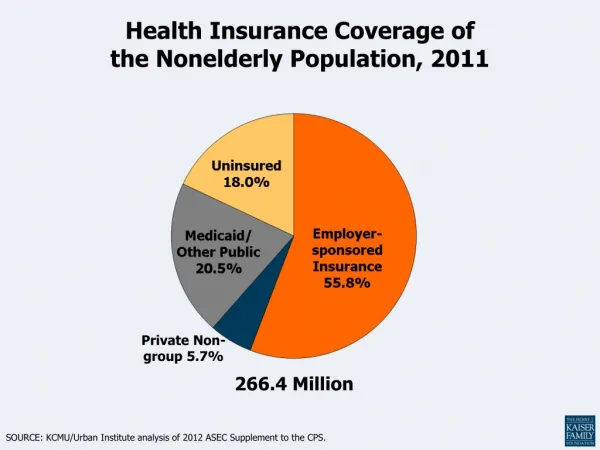
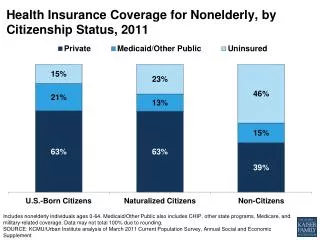
Uninsured Rates Among the Nonelderly by State, 2010-2011 ME VT WA NH MT ND MN OR MA NY WI SD ID MI RI CT WY PA NJ IA NE OH DE IN IL NV MD CO UT WV DC VA CA KS MO KY NC TN AZ SC OK AR NM GA AL MS LA TX AK FL HI < 14% Uninsured (14 states, including DC) 14-18% Uninsured (20 states) > 18% Uninsured (17 states) SOURCE: KCMU/Urban Institute analysis of 2012 ASEC Supplement to the CPS.