Download
1 / 7
70 likes | 94 Vues
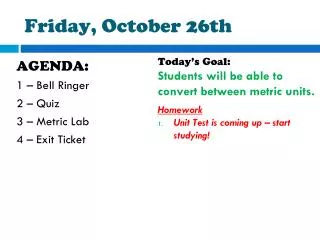
Today's agenda includes filling in your planner, practicing exercises 2-7, and preparing for a test on Thursday. Learn about mean, median, mode, range, and stem-and-leaf plots. Understand how to find these measures of central tendency and organize data effectively. Improve your math skills and boost your understanding of statistical vocabulary.

E N D
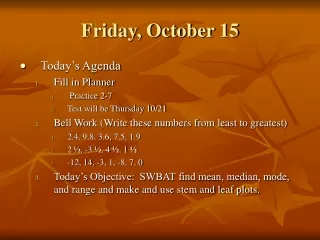
Friday, October 15 • Today’s Agenda • Fill in Planner • Practice 2-7 • Test will be Thursday 10/21 • Bell Work (Write these numbers from least to greatest) • 2.4, 9.8, 3.6, 7.5, 1.9 • 2 ½, -3 ½, 4 ½, 1 ½ • -12, 14, -3, 1, -8, 7, 0 • Today’s Objective: SWBAT find mean, median, mode, and range and make and use stem and leaf plots.
Vocabulary • Measures of central tendency: A way to organize and summarize data. • Mean: Mean is best used to describe a set of data that has no outlier. It is found by dividing the sum of the data items by the total number of data items. • outlier: a data value that is much higher or lower than the other data values in the set.
Vocabulary • Median: the middle value in the set when the numbers are arranged in order. For a set containing an even number of data items, the median is the mean of the two middle data values. Median is best used to describe a data set that does have an outlier. • Mode The data item that occurs the most often. It is possible to have no mode, one mode, or more than one. Mode is best used to describe data when the values are not numeric or when looking for the most popular item.
Example 1: Find the mean, median, and mode. • Hourly wages of employees at a local restaurant are $6.25, $7.10, $8.12, $7.15, $6.75, $5.95, $8.05. Find the mean, median mode and range. Which of these measures of central tendency best describes the data set? Mean x x x x x x 5.95, 6.25, 6.75, 7.10, 7.15, 8.05, 8.12 Median $7.10 is the median value. List the date in order from least to greatest For this data set, there is no mode because no value appears more than once. Mode
Example 2: Solving an equation • Suppose your grades on your last three algebra tests are 80, 93, and 91. What grade do you need on the next test to have a 90% average? Multiply both sides of the equation by 4 to clear the denominator Simplify Subtract 264 from each side You need at least a 96% to have an average of 90% on your tests.
Stem and Leaf Plot • A display of data made by using the digits of the values. The last digit is the leaf and all the digits to left of the last digit are the stem. 51, 84, 86, 88, 92, 99, 113, 114, 121, 122, 124, 138, 144, 147, 148, 151 Let's make one!
Today’s Objective: SWBAT find mean, median, mode, and range and make and use stem and leaf plots.