Download
1 / 1
30 likes | 135 Vues
Example: lifetimes for ball bearings in millions of resolutions : 17.88, 28.92, 33.00, 41.52, 42.12, 45.60, 48.48, 51.84, 51.96, 54.12, 55.56, 67.80, 68.64, 68.88, 84.12, 93.12, 98.64, 105.12, 105.84, 127.92, 128.04, 173.40. Evaluate the empirical cdf Choose class of cdf to model the data

E N D
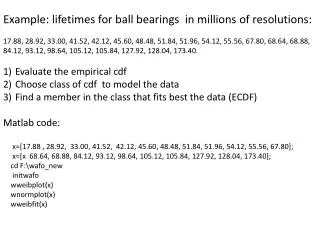
Example: lifetimes for ball bearings in millions of resolutions: 17.88, 28.92, 33.00, 41.52, 42.12, 45.60, 48.48, 51.84, 51.96, 54.12, 55.56, 67.80, 68.64, 68.88, 84.12, 93.12, 98.64, 105.12, 105.84, 127.92, 128.04, 173.40. Evaluate the empirical cdf Choose class of cdf to model the data Find a member in the class that fits best the data (ECDF) Matlab code: x=[17.88 , 28.92, 33.00, 41.52, 42.12, 45.60, 48.48, 51.84, 51.96, 54.12, 55.56, 67.80]; x=[x 68.64, 68.88, 84.12, 93.12, 98.64, 105.12, 105.84, 127.92, 128.04, 173.40]; cd F:\wafo_new initwafo wweibplot(x) wnormplot(x) wweibfit(x)