Download
1 / 1
20 likes | 113 Vues
Explore trace gas abundances in Venus' atmosphere using detailed synthetic spectra to assess emission spectrum impacts and gas abundance changes. Radiative Transfer models are employed for near-infrared analysis. Sensitivity of thermal emission to trace gas variations is demonstrated.

E N D
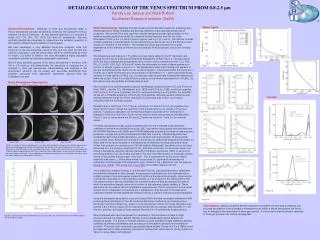
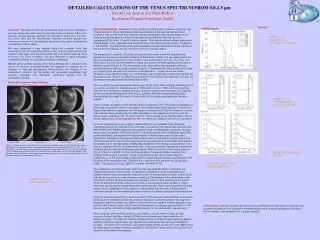
Model Inputs: Abstract/Introduction:Retrievals of trace gas abundances deep in Venus’ atmosphere are best achieved by observing the nightside of Venus between 0.8 and 2.5 microns. At high spectral resolution, it is possible to obtain H2O, CO, SO2, CO, OCS, HCl and HF abundances. Accurate synthetic spectra are necessary to assess how the emission spectrum in this region is affected by abundances of these gases. We have developed a very detailed line-by-line computer code that accounts for the non-Lorentzian nature of CO2 and H2O lines far from line centers in this region, and line mixing within the P, Q, and R branches of the 15 micron CO2 band. In addition, we have developed a highly adjustable correlated-k scheme for calculating absorption coefficients. We will show synthetic spectra of the Venus atmosphere in emission form 0.8 to 2.5 microns, and demonstrate the sensitivity of outgoing flux to changes in trace gas abundances. Demonstrating that changes in the atmospheric emission can be quickly and accurately determined from opacities calculated from absorption coefficients derived from the correlated k scheme Model Methodology: Radiative Transfer models provide the basic means for analyzing near-infrared spectra of Venus’ nightside and deriving estimates of gas abundances and cloud properties. We use the Toon et al. rapid two-stream hemispheric mean approximation to the radiative transfer equation to model the expected thermal emission from the top of the atmosphere (TOA) in the 1.2 and 2.3 micron regions (see e.g. Fig 1 and 2). This method includes multiple scattering in infrared bands for flux calculations as well as the use of the Planck source function for emission in the infrared. The hemispheric mean approximates the angular dependence of the intensity so that the flux and intensity from an isotropic source are correctly related. The temperature and pressure T, P, profiles and gas mixing ratios for the RT calculation are derived from the Venus International Reference Atmosphere (VIRA) Figure 3. The gas opacity within the Venus atmosphere is assumed to be a function of the contributions from: CO2, H2O, SO2, CO, HDO, OCS, H2S, HCl and HF, where the mixing ratio for each of these species as a function of altitude is given in Figure 3-a. The atmospheric water vapor mixing ratio appears to be near constant below the Venus clouds, at about 30 ppmv. It decreases within the clouds as it is taken up in liquid H2SO4 aerosols, and achieves an abundance of ~ 1 ppmv above the clouds. Variation in these species is likely, e.g., CO has been seen to generally increase with altitude just below the clouds. Since it is oxidized by the products of the thermal decomposition of H2SO4, it’s abundance may vary spatially and temporally as well. Also included in the total atmospheric opacity are Rayleigh scattering due to CO2 and N (van de Hulst, 1981) 2 and the CO2 (Moskalenko et al. 1979) and H2O (Liou, 1992) continuum opacities (see Figure 4). As Figure 4 indicates, the CO2 continuum opacity is poorly known. For simplicity we did not include Mie scattering of the H2SO4/H2O particles. Although aerosol scattering does strongly affect the overall flux levels, absorption is essentially grey in the 1-3 mm region associated with the trace gas species. Radiation due to H2O from 1.0 to 1.35 mm, and due to CO from 2.2 to 2.4 mm originates from above 20 km.Figure 5 shows the sensitivity of the thermal emission to variation in the trace species. In particular calculations of the thermal emission expected at the TOA based on integration of the flux from 100 to 20 km for the nominal Venus atmosphere model depicted in Figure 3, and for cases where the CO and H2O levels are varied to ½ and 2 x the nominal values. For these calculations the gas opacity is determined from the correlated k gas absorption coefficients derived from detailed line-by-line (LBL) calculations using optical data obtained from the HITRAN (Rothman et al. 2005) and HITEMP databases assuming the range of temperatures, pressures, and gas mixing ratios indicated by VIRA (see Figure 6). Individual spectral lines, modeled by rapid Voigt profile calculations, are resolved with approximately 10 wavenumber points in their cores. Spectral line strengths in the wings are determined to about 6 half-widths on either side of line center because of the importance of extending the wing calculations much further from spectral line centers (up to 120 half-widths). Additionally, the effects of line mixing is accounted for. Line mixing is significant for CO2 and other molecules. In the current model, line mixing is handled by using the ab initio methods of Hartmann and Boulet (1991) to account for line mixing effects in CO2 at 10 bars and 400 K. For H2O, the finite duration of molecular collision results in line profiles that are super-Lorentzian. This is accounted for by the use of simple empirical coefficients, c, so the wider shape is accounted for, significantly increasing the contribution from the wings of the absorption lines. Details of the c-factors for H2O are given by Clough et al. (1989). See Goody and Yung (1989) for a similar treatment for CO. The k-distribution method is based on the fact that if the LBL calculated absorption coefficients are redistributed based on their strength, the absorption coefficients can be subdivided into a suitable number of bins arranged as a smooth function of the absorption strength, known as the k-distribution according to a new frequency variable, g. The essence of the ckd scheme is that this smooth function can be subdivided into a smaller number of bins according to the rate at which the absorption strength varies as a function of the frequency space variable, g. These same bins can be used at various temperature and pressures. That is, as long as the line center remains fixed, independent of the pressure or temperature, then the rank of the absorption coefficient strength and the wavelength remains fixed as a function of pressure and temperature. Using the techniques described in Lacis and Oinas (1991) we have developed schemes for both producing the k-distribution of the LBL produced absorption coefficients and reducing the k-distribution into bins of length Dgn, where n is the subinterval number. For these calculations we split the 0.8-2.5 micron region into 67 spectral intervals with an average spectral width of~ 0.02 microns, and then split each of these spectral intervals into 16 subintervals or gauss points. When combined with rapid two-stream flux calculations, the ckd method is ideal for high-accuracy General Circulation Models (GCMs) and automated rapid remote detection of dangerous gases. The effects of multiple scattering can be included if single scattering albedos, scattering asymmetry parameters, and abundance of atmospheric aerosols are estimated or provided. The much more commonly used spectral band models (Goody and Yung 1989) cannot be integrated with multiple scattering calculations, making them inaccurate for cloudy (Earth and Venus) or dusty (Mars) atmospheres. DETAILED CALCULATIONS OF THE VENUS SPECTRUM FROM 0.8-2.5 mm b Figure 3 a c Venus Atmosphere Observations Venus 2.3 mm IRTF Observations acquired by Elliot Young and Mark Bullock Results: a Figure 4 May 4, 2004 May 5, 2004 May 6, 2004 Kandis Lea Jessup and Mark Bullock Southwest Research Institute (SwRI) May 8, 2004 May 9, 2004 May 10, 2004 a Figure 1: Images of Venus’ nightside at 2.3 mm, taken with the SpeX instrument at the IRTF on Mauna Kea. SpeX acquires images and spectra simultaneously (the dark line is the spectrometer slit, 0.3” x 60”). By allowing the slit to drift across Venus over about 10 minutes, image cubes from 0.8 to 2.5 mm were obtained. Thermal radiation orginating from 30-35 km silhouettes Venus lower clouds, so that where the image is dark, the lower clouds are thickest. Venus’ appearance changes dramatically from one morning to the next, due to the 6 day rotation of the cloud deck at this level. b b Figure 5 Figure 6 Conclusions: Gaseous opacities derived using the correlated k scheme lead to effective and accurate calculations of the changes in thermal emission within a dense atmosphere like Venus due to changes in the abundance of trace gas species. It is thus well-suited for efficient retrievals of trace gas species from remote sensing data. Figure 2: Spectra of the Venus’ nightside at 2.3 mm, taken with the SpeX instrument at the IRTF on Mauna Kea by Marq et al. 2005.


![Difference between Channel 2 (0.8 m ) and Channel 1 (0.6 m ) [BRIT]](https://cdn5.slideserve.com/9690092/vegetation-mapping-dt.jpg)