Download
1 / 36
370 likes | 410 Vues
Explore the intricate life history of aquatic organisms, including trade-offs between growth and reproduction, diverse reproductive strategies, and the dynamics of populations in various environments.

E N D
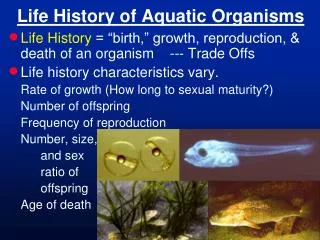
Life History of Aquatic Organisms • Life History = “birth,” growth, reproduction, & death of an organism --- Trade Offs • Life history characteristics vary. Rate of growth (How long to sexual maturity?) Number of offspring Frequency of reproduction Number, size, and sex ratio of offspring Age of death
immediately before first reproduction reproductive value age Life History • Reproductive Value = the average number of offspring in a population that remain to be born to individuals of a certain age. • Fecudity= # of ova produced by a female. • Fertility = # of offspring produced by a female. • Fecundity ≠ Fertility Fertility≤ Fecundity
= expected if directly proportional = observed Difference invested in growth etc. Fish Fecundity with Age FECUNDITY AGE sexual maturity
Iteroparity & Semelparity • Iteroparity = individuals may reproduce in >1 reproductive season during its life. (most organisms) • Semelparity = individuals may reproduce in 1 reproductive season during its life. “BIG BANG” reproduction; all energy to repro.(squid, octopus, some Pacific salmon)
Parental Care • Broadcast Spawning = buoyant eggs externally fert.; no parental care; many small eggs. • Egg Scattering = non-buoyant, non-adhesive eggs externally fert.; no parental care; many small eggs. • Shelter Spawning = non-buoyant, adhesive eggs laid in existing shelter; parental care via guarding & egg care in many. • Nest Building = non-buoyant, eggs laid in created shelters; parental care in nest construction, many guard & clean eggs. • Brooding/Bearing = non-buoyant, adhesive eggs externally fert. & laid on a parent; care extensive. • Livebearing = eggs fertilized inside female and develop there; female parental care extensive.
Fish Crustacean SIZE SIZE AGE AGE Growth of Individuals • Fishes are said to have indeterminate (never ending) growth. However, growth does plateau.
Populations in Fisheries Context • Population = individuals of one species that simultaneously occupy a defined area • Deme = individuals of one species that form a distinct reproductive community • (Fisheries) Stock = individuals of one species that share common production characteristics and support the same basic fisheries. • Year Class (Cohort)= All the individuals in a population born/hatched in a single “year” • Year Class Strength = the number of individuals in a year class
Size of Individuals in a Pop. • Older individuals (esp. fish) usually are larger. • Year class structure can often be seen in the size distribution of individuals in a population. Individuals in a Seasonally Reproducing Population # SIZE
Survivorship & Mortality • Survivorship = percent / proportion of the initial year class that survives • Mortality = percent / proportion of the year class that dies over a given time period • Most commercial species exhibit high mortality when young, AND with great year to year mortality variation due to climate. This is associated with HIGH FECUNDITY. Why?
Population/Stock Change • Population size = (births + immigration) - (deaths + emigration) • Stock size = (recruitment + immigration) - (harvest + predation + emigration) • Recruit = individual enters the catchable population. • Recruitment = number of recruits that enter a stock over a given time period. Year classes may all recruit around the same time if size variation is low.
K 1/2 K Population Growth • Logistic growth • rmax = rate of increase, N = pop. size • K = carrying capacity • dN/dt = rmax N [(K-N)/K] A “bad year” can lower K & a “good year” can elevate K. N t
Population Growth • Logistic growth • rmax = rate of increase, N = pop. size • K = carrying capacity • dN/dt= rmaxN [(K-N)/K] • higher fecundity • lower fecundity K N 1/2 K t
1/2 K K Population Growth • Logistic growth • rmax = rate of increase, N = pop. size • K = carrying capacity • dN/dt= rmaxN [(K-N)/K] Would higher or lower fecundity affect this? dN/dt N
Predation • Interspecific Predation = Consumption of an individual of one species by another • Cannibalism (Intraspecific Predation) = consumption of an individual by a member of the same species (includes egg cannibalism) Density Dependent - increases with density • Predation direct effects = death or injury • Predation indirect effects = predation avoidance reduced movement, reduced feeding, &/or reduced breeding reduced individual condition &/or pop. size
Density & Predation Risk • Density Independent Predation = predation risk per individual is independent of prey density • Direct Density Dependent Predation = predation risk increases with prey density • Inverse Density Dependent Predation (Depensatory) = predation risk decreases with prey density (swamping)
Competition • Intraspecific Competition usually more significant than interspecific competition. • Effects density dependent and usually indirect (less to go around). • When two species are using the same resource… 1. they are competing… or 2. the resource is not limiting (e.g., seasonally abundant).
snails & benthic inverts. zooplankton small fish, surface insects, & macrophytic inverts. Lepomis Competition Lepomis gibbosus Lepomis macrochirus Lepomis cyanellus
Population Management • Which populations can stand the greatest harvest? Ones with a high reproductive rate. (usually have low early survivorship) Have many offspring. Reproduce frequently. Mature quickly. • Which individuals are harvested? What is the reproductive value of harvested individuals?
Fisheries Recruitment Models • Used to predict stock size to manage stocks. How much, where, and when can we harvest? • Beverton-Holt Model - Recruitment increases with stock size but comes to an asymptote at some level. (More adults = more recruits but pre-recruits resource limited.) • Ricker Model - Recruitment peaks at some intermediate level of stock abundance and declines at higher abundance. (More adults = more cannibalism/competition & pre-recruits resource limited.)
Recruitment Models Recruit- ment Biomass Beverton- Holt Stock Biomass Recruit- ment Biomass Ricker Stock Biomass
Beverton-Holt & Ricker Models • Which model applies to which stock? Pre-recruit competition and cannibalsim? • Used in the 1970s but abandoned in 1980s. • Theory supported but most data didn’t really support. Year to year variance very high. • What other things do you think might affect recruitment? (i.e. What caused the variance?)
BΦ 1/2 BΦ Stock Growth • k = intrinsic rate of stock increase ( rmax) • B = stock biomass ( N) • BΦ = unexploited stock size ( K) • dB/dt = kB [(BΦ -B)/ BΦ] B t
1/2 BΦ BΦ Rate of Stock Growth • Maintaining the stock at 1/2 BΦ maintains the greatest yield. • Maximum Sustainable Yield (MSY) dB/dt B
Problems with MSY • Only a few terms in the model (B, BΦ, k). • Difficult to identify a discrete “stock.” • Estimating stock biomass (B) and possible intrinsic rate of stock increase (k) is difficult. • Estimating maximum stock size (BΦ) is incredibly difficult. BΦ (like K) often varies from year to year.
MSY History • MSY developed in 1930s. • Becomes commonly used in the U.S. in 1950s & U.S. had MSY made the goal of international fisheries management in 1955. • Challenged by academics in the late 1970s. • Only abandoned in govmt. in the mid-1990s after the collapse of the Atlantic cod fishery. -Peruvian anchovetta fishery in 1972 -Atlantic herring fishery in 1977 -Atlantic cod fishery collapse in 1993
MSwhY? • Why was MSY used for so long and only tweaked?
U.S. Fisheries Agencies Hist. • 1903 - Bureau of Fisheries (Dept. of Labor & Commerce) • 1939 - Bureau of Fisheries subsumed into the new Fish and Wildlife Service (FWS) (Dept. of Interior) - Sport and Commercial fisheries • 1956 FWS internally split into “sport” & “commercial” (MSY management) agencies • 1960s - Great Lakes fisheries collapse • 1970 - Fish and Wildlife Service (FWS) (Dept. of Interior) for “sport” & National Marine Fisheries Service (NMFS) = for “commercial” (NOAA, Dept. of Commerce)
U.S. Fisheries Management Presidentt Enviro. Protect. Agency (EPA) Other Depts. Interiort Commercet Fish & Wildlife Service (FWS) Natl. Ocean Atmos. Admin. (NOAA)t Natl. Marine Fisheries Serv. (NMFS)t
Magnuson-Stevens Act, 1976 • Extended U.S. territorial limits to 200 miles (most of the continental shelf) from 12 miles. • Required re-negotiation of all fisheries treaties in response to “foreign” fishing • Required NMFS to manage fisheries for optimal benefit to society (OSY) not just MSY. American Fisheries Promotion Act, 1980 • Provided grants to the fishing industry and boat loan default guarantees. • Directed identification of “new” stocks • Goal = increase U.S. fishing
Sustainable Fisheries Act, 1996 • Modified Magnuson-Stevens Act • Emphasized ending “overfishing” • OSY redefined as MSY as reduced by social, economic or ecological factors. • Required NMFS regulate to reduce bycatch.
Endangered Species Act, 1973 • Endangered = in danger of extinction in all or a significant portion of its range • Threatened = is likely to become Endangered in the foreseeable future • Provides protection from “harvest and loss of critical habitat.” – NO EXCEPTIONS 1976 Based on ESA Supreme Court stops Tellico Dam project Percina tanasi (snail darter) vs. Tennessee Valley Authority
Endangered Species Act, 1978 • Congress amended the ESA to create an Endangered Species Committee that could give exemptions & required economics be considered. • 1979 - the Endangered Species Committee did NOT give a Tellico Dam exemption. • 1979 - Congress gave a specific exemption. Tellico Dam
How are fisheries managed? How should fisheries be managed? Freshwater? Marine?