Download

1 / 8
80 likes | 214 Vues
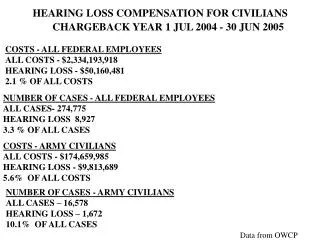
This report provides detailed OLAP queries for analyzing FoodMart's sales data as of June 2, 2005. It includes metrics such as units shipped and ordered by store, sales of product brands as a percentage of subcategory sales, and accumulated sales by month in 1997. The data highlights the shipping and ordering performance across multiple stores, facilitating insights into promotional effectiveness and inventory management. Key trends and variances in sales performance are summarized to assist in strategic decision-making for inventory and promotions.

E N D
Thu Jun 2 2005 FoodMart 2000 OLAP Queries small version Source: XXXX
Unit Sales by Promotion Media Type Subheading Source: XXXX
Sales of a Product Brand as a percentage of the sales of that product within its subcategory Source: XXXX
Units Shipped and Ordered by Store Subheading Store Units Shipped Units Ordered Store 6 10,759 11,699 Store 7 24,587 26,463 Store 24 23,835 26,270 Store 14 1,696 1,875 Store 11 8,515 9,109 Store 13 32,393 35,797 Store 2 2,348 2,454 Store 3 22,734 24,610 Store 15 24,110 26,703 Store 16 11,889 12,828 Store 17 32,411 35,930 Store 22 1,860 2,074 Store 23 10,589 11,426 Source: XXXX
Sales and Accumulated Sales by Month (1997) Source: XXXX
Monthly Year-to-Date Sales for each product category in 1997 Source: XXXX
Top Store Costs by City Subheading Source: XXXX
Store Sales by Month with +/- 3 St.Dev. Control Source: XXXX