Download
1 / 59
590 likes | 762 Vues
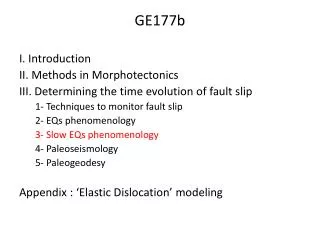
GE177b . I. Introduction II. Methods in Morphotectonics III. Determining the time evolution of fault slip 1- Techniques to monitor fault slip 2- EQs phenomenology 3- Slow EQs phenomenology 4- Paleoseismology 5- Paleogeodesy Appendix: ‘Elastic Dislocation’ modeling.

E N D
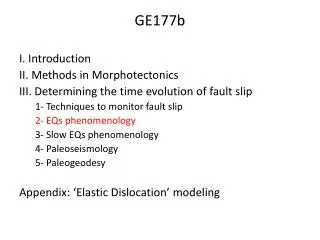
GE177b I. Introduction II. Methods in Morphotectonics III. Determining the time evolution of fault slip 1- Techniques to monitor fault slip 2- EQs phenomenology 3- Slow EQs phenomenology 4- Paleoseismology 5- Paleogeodesy Appendix: ‘Elastic Dislocation’ modeling
Mw=7.1 Mw=6.5 Yet, these measurements only give a ‘partial’ vision of the slip distribution on the rupture fault, for they only represent the (small?) portion of the slip that has reached the surface. Mw=7.3 Mw=7.3 Besides, such complete measurements are quite rare and really reliable for strike slip faults only. Mw=7.1 Mw=7.6 (Manighetti et al, 2007)
Co-seismic displacement field due to the 1992, Landers EQ G. Peltzer (based on Massonnet et al, Nature, 1993)
Here the measured SAR interferogram is compared with a theoretical interferogram computed based on the field measurements of co-seismic slip using the elastic dislocation theory Co-seismic displacement field due to the 1992, Landers EQ This is a validation that coseismic deformation can be modelledacurately based on the elastic dislocation theory G. Peltzer (based on Massonnet et al, Nature, 1993)
A common approach to investigate earthquake physics consists of producing kinematic source models from the inversion of seismic records jointly with geodetic data. Seth Stein’s web site
Kinematic Modeling of Earthquakes • Parameters to find out (assuming a propagating slip pulse) • Slip at each subfault on the fault • Rise time (the time that takes for slip to occur at each point on the fault). • Rupture velocity (how fast does the rupture propagate)
Landers (1992, Mw=7,3) Hernandez et al., J. Geophys. Res., 1999
Nord Sud Joined inversion of geodetic, inSAR data and seismicwaveforms Hernandez et al., J. Geophys. Res., 1999
Nord Sud
Nord Sud
Nord Sud
Nord Sud
Nord Sud
Nord Sud
Nord Sud
Nord Sud
Nord Sud
Nord Sud
Nord Sud
Nord Sud
Nord Sud
Nord Sud
Nord Sud
Nord Sud
Nord Sud
Nord Sud
Nord Sud
Nord Sud
Nord Sud
Nord Sud
Nord Sud
Nord Sud Hernandez et al., J. Geophys. Res., 1999
Observed and predicted waveforms Strong motion data Hernandez et al., J. Geophys. Res., 1999
Some characteristics of the Mw 7.3 Landers EQ: • Rupture length: ~75 km • Maximum slip: ~ 6m • Rupture duration: ~ 25 seconds • Rise time: 3-6 seconds • Slip rate: 1-2 m/s • Rupture velocity: ~ 3 km/s
Kinematic inversion of earthquake sources show that • Seismic ruptures are “pulse like” for large earthquakes (Mw>7) with rise times of the order of 3-10s typically (e.g, Heaton, 1990) • the rupture velocity is variable during the rupture but generally close to Rayleigh waves velocity (2.5-3.5 kms) and sometimes ‘supershear’ (>3.5-4km/s) • Seismic sliding rate is generally of the order of 1m/s • Large earthquakes typically ruptures faults down to 15km within continent and down to 30-40km along subduction Zones.
Quantification of EQs- Moment • Seismic Moment tensor ( in N.m): • Scalar seismic Moment (N.m): M0= .D.S • where D is average slip, S is surface area • and m is elastic shear modulus (30 to 50 GPa) Slip Potency (in m3): P = D.S (Integral of slip over rupture area) Moment Magnitude: Mw = 2/3 * log10Mo - 6.0 (where M0 in N.m)
A planar circular crack of radius a with uniform stress drop, Ds, in a perfectly elastic body (Eshelbee, 1957) The predicted slip distribution is elliptical Dmean and Dmax increase linearly with fault length (if stress drop is constant). Quantification of EQs:The Elastic crack model Slip on the crack Stress on the crack NB: This model produces un realistic infinite stress at crack tips See Pollard et Segall, 1987 or Scholz, 1990 for more details
Quantification of EQs: The Elastic crack model A rectangular fault extending from the surface to a depth h, with uniform stress drop (‘infinite Strike-Slip fault) The predicted slip distribution is elliptical with depth Maximum slip should occur at the surface Dmean and Dmax should increase linearly with fault width (if stress drop is constant) and be idependent of fault length. See Pollard et Segall, 1987 or Segall, 2010 for more details
Quantification of EQs: The Elastic crack model Coseismic surface displacements due to the Mw 7.1 Hectore Mine EQ measured from correlation of optical images(Leprince et al, 2007)
Quantification of EQs: The Elastic crack model Ds of the order of 5 MPa
Quantification of EQs: The Elastic crack model • The crack model works approximately in this example, In general the slip distribution is more complex than perdicted from this theory either due to the combined effects of non uniform prestress, non uniform stress drop and fault geometry. • The theory of elastic dislocations can always be used to model surface deformation predicted for any slip distribution at depth,
Quantification of EQs- Stress drop Average static stress drop: • S is rupture area; a is characteristic fault length (fault radius in the case of a circular crack, width of inifinite rectangular crack). • C is a geometric factor, of order 1, C= 7p/8 for a circular crack, C=½ for a infinite SS fault. • is equivalent to an elastic stiffness (1-D spring and slider model). Given that The stress drop can be estimated from the seismological determination of M0 and from the determination of the surface ruptured area (geodesy, aftershocks).