Download
1 / 13
130 likes | 310 Vues
Examination of the tropical cyclone environment through comparison of COSMIC with other satellite data. Christopher M. Hill, Patrick J. Fitzpatrick, and Yee Lau Geosystems Research Institute / Northern Gulf Institute Mississippi State University March 3, 2009

E N D
Examination of the tropical cyclone environmentthrough comparison of COSMICwith other satellite data Christopher M. Hill, Patrick J. Fitzpatrick, and Yee Lau Geosystems Research Institute / Northern Gulf Institute Mississippi State University March 3, 2009 63rd Interdepartmental Hurricane Conference
Motivation to use COSMIC • Tropospheric sounding data are provided: • in the absence of reconnaissance flights or other satellite data • in cloudy or rain-filled regions, where other satellite data are contaminated • Regions or layers of contrasting moisture content can be identified within: • the span and depth of a Saharan Air Layer (SAL) • the core of a tropical cyclone
Motivation to use COSMIC The radio occultation method gives refractivity (N) from GPS signal delay [dry term] [wet term] Given N(p), it is possible to solve for T and/or e (and therefore Td) According to Ware et al. (1996), the error of e in terms of the error of T is: With N and p known, a value of T known within ± 3 K can typically provide a value of e within ± 1 hPa
Methodology • Within the environment of the tropics, where temperature differences are small, the analysis of refractivity (N) alone can provide useful information regarding the distribution of moisture within one of the profiles • COSMIC data are collected in the vicinity of recent tropical cyclones • Helene 2006, Dean 2007, Bertha 2008 • Based on water vapor imagery and METEOSAT SAL (12.0 μm minus 10.8 μm) imagery, likely “dry” and “moist” profiles are qualitatively identified and differenced • To detect SALs, COSMIC refractivity data are compared against CALIPSO aerosol subtype data
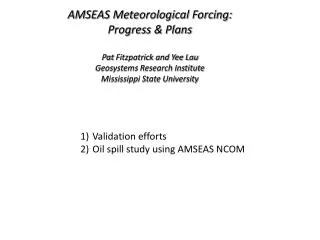
Differences of COSMIC refractivity between SAL and non-SAL columns (approx. 00 UTC 16 Sept 2006) Helene SAL column point non-SAL column point METEOSAT-8 SAL imagery provided by CIMSS / SSEC / Univ. of WI COSMIC retrieved dewpoint (°C) COSMIC refractivity Non-SAL minus SAL refractivity Difference of 41 at 3.2 km
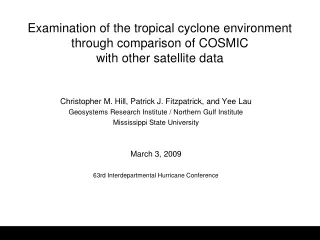
COSMIC and CALIPSO data near Dean 200717 Aug 2007 COSMIC refractivity difference [ C1 – C2 ] Retrieved Td difference [ C1 – C2 ] ~ 04:30 UTC 17 Aug 2007 NASA Difference of 20 at 4.8 km SAL Influence of ΔT ? COSMIC #1 COSMIC #2 CALIPSO COSMIC point #1: 29.0°N 50.6°W COSMIC point #2: 20.3°N 51.9°W GOES-12 imagery provided by NCDC 03 UTC 17 August 2007 CALIPSO aerosol subtypes 05:17 – 05:22 UTC 17 August 2007 COSMIC #1 COSMIC #2
Methodology COSMIC profile 4th-order polynomial • COSMIC data are found within the circulation area of recent tropical cyclones • STY Sepat 2007, Bertha and Ike 2008 • 4th-order polynomial curve fitted against COSMIC profile • difference between profile and fitted curve should show refractivity (moisture) anomalies • COSMIC data are compared against water vapor and microwave imagery to determine cyclone structure
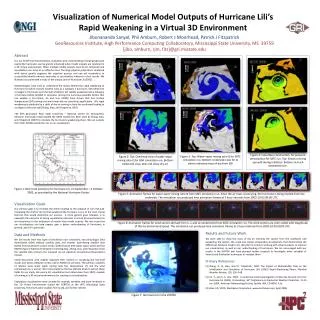
COSMIC and CALIPSO data near Bertha 200808 July 2008 Difference of COSMIC refractivity profile and 4th-order fitted curve 14:19 UTC 08 July 2008 CALIPSO aerosol subtypes ~ 04:32 UTC 08 July 2008 NASA est. radius of max. wind Bertha center CALIPSO pass intersection heights
COSMIC and CALIPSO data near Bertha 200808 July 2008 NRL NRL Difference of COSMIC refractivity profile and 4th-order fitted curve 14:19 UTC 08 July 2008 CALIPSO aerosol subtypes ~ 0432 UTC 08 July 2008 Eye ? [ S Eyewall ? COSMIC profile AMSU-B 13:48 UTC 08 July 2008 GOES-12 VIS 13:45 UTC 08 July 2008 E Eyewall ? est. radius of max. wind rainbands? Bertha center CALIPSO pass intersection heights
COSMIC analysis of Hurricane Ike 2008 NRL est. radius of max. wind NHC 06 UTC 06 Sept NOAA-18 AMSU-B 06:23 UTC 06 Sept 2008 Refractivity Difference profile minus 4th-order fitted curve dry air [ Rainbands? GOES-12 WV 06:45 UTC 06 Sept 2008 05:25 UTC
Eyewall replacement cycle with Supertyphoon Sepat 08/16/2007 microwave imagery archived at the Naval Research Laboratory Aqua AMSR-E 04:48 UTC (15 Aug) NOAA-17 AMSU-B 01:39 UTC NOAA-15 AMSU-B 08:44 UTC F-13 SSMI 09:37 UTC F-16 SSMIS 11:51 UTC Aqua AMSR-E 17:42 UTC
COSMIC analysis of Supertyphoon Sepat 2007 NRL ATCF 06 UTC 16 Aug COSMIC AMSU-B 08:44 UTC 16 Aug 2007 Refractivity Difference profile minus 4th-order fitted curve COSMIC profile relative to estimations of the storm center and the radii of concentric eyes SW Outer Eyewall ?? Outer Eye ?? Inner Eyewall?? Outer Eye ?? 06:05 UTC
Some conclusions on use of COSMIC near tropical cyclones • Difference of COSMIC refractivity can show dry air signature of SAL • Combined use of COSMIC and CALIPSO can definitively show SAL • COSMIC can detect inner core features of a cyclone hidden under the cirrus canopy (precise matching with other data is crucial !) • COSMIC may help to determine the stage of eyewall replacement cycle Acknowledgments The organization of COSMIC for the COSMIC profile data CIMSS / SSEC / Univ. of WI, NRL, NCDC, and NASA for satellite data Dr. Eric Hendricks for a helpful poster discussion