Download
1 / 46
460 likes | 563 Vues
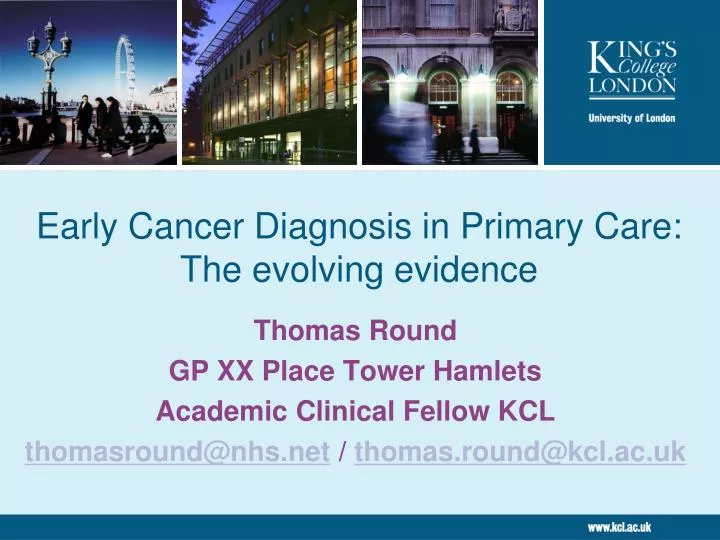
Early Cancer Diagnosis in Primary Care: The evolving evidence. Thomas Round GP XX Place Tower Hamlets Academic Clinical Fellow KCL thomasround@nhs.net / thomas.round@kcl.ac.uk. Or “Spotting the needle in the haystack”. Thomas Round. The UK Cancer Context.

E N D
Early Cancer Diagnosis in Primary Care:The evolving evidence Thomas Round GP XX Place Tower Hamlets Academic Clinical Fellow KCL thomasround@nhs.net / thomas.round@kcl.ac.uk
Or “Spotting the needle in the haystack” Thomas Round
The UK Cancer Context • More than 331,000 people were diagnosed with cancer in 2011 in the UK (CRUK 2014) • Overall cancer incidence rates in the UK have increased by more than a third since the mid-1970s • By 2030 the incidence is expected to rise by 45% (Mistry 2011). • By 2020 almost 1 in 2 will get cancer in their lifetime (Macmillan 2013). • Cancer causes more than one in four of all deaths (159,000) in the UK • Half of people diagnosed with cancer now survive for at least 10 years • Cancer survival rates in the UK have doubled in the last 40 years (CRUK 2014)
The UK Cancer Context • UK cancer survival rates are lower than many European countries (De Angelis 2013). • 5,000-10,000 deaths per annum (within 5 years of diagnosis) might be avoided if survival rates matched the best in Europe (Abdel-Rahman 2009). • Parts of the UK have achieved outcomes comparable to the best in Europe (Round 2013). • Within the UK, and even London itself, there is a difference in survival rates (CRUK 2011). • Late diagnosis is a major contributing factor to poor cancer survival rates in the UK (DoH 2007) • It is estimated that about half of the difference in survival is due to ‘late diagnosis’ (Neal 2014)
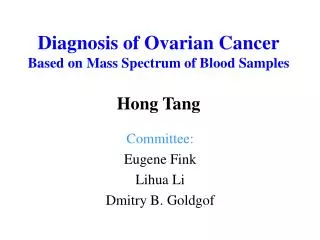
ICBP: 1 year relative survival Coleman et al, Lancet 2011 Colorectal Cancer 1yr RS Lung Cancer 1yr RS Breast Cancer 1yr RS Ovarian Cancer 1yr RS
The Tower Hamlets Context Cancer diagnosis and survival rates in Tower Hamlets and Kensington and Chelsea. Emergency route diagnosis Cancer survival rates Thomas Round
The primary care cancer context • The diagnosis of cancer in general practice is not straightforward (Hamilton 2004). • A GP is likely to see 8 - 9 new cancer cases per year, and possibly 1000s with symptoms potentially of cancer (Richards 2009) • Even for the commonest of cancers (eg lung, colorectal, breast) an individual GP is likely to see on average about one new cases per annum. • For rarer cancers a GP will see a new case of ovarian cancer once every 5 years and a new case of testicular cancer every 20 years. • Patient, doctor and system related factors can all contribute to delayed cancer diagnosis (Hansen 2008). • Concerns about cancer diagnostic delay led to urgent suspected cancer referral routes, such as 2 week wait (2ww) in England (DoH 2000). • For all urgent suspected cancer referrals (2ww) from GPs 10% will have cancer (PPV).
The Symptom Iceberg (McAteer 2010) Thomas Round
Cancer Policy Initiatives • Urgent referral pathways for suspected cancer (2000) • NICE guidelines for urgent referral (2005). (Being re-visited due 2015) • Cancer Reform Strategy (2007) • Identifies early diagnosis as key to improving outcomes • National Awareness and Early Diagnosis Initiative (NAEDI) • Improving Outcomes: A Strategy for Cancer (Jan 2011) • Sets out Government’s ambition to save an additional 5000 lives p.a.
Does delay make a difference to outcome? • Intuitive answer is ‘yes’ • Remarkably difficult to confirm • Differences in definitions, measurement of delay, outcome measures • Failure to account for differences in aggressiveness • Lead time bias • Delays of 3-6m for breast cancer result in 7% lower 5-year survival than delays of <3m (Richards Lancet 1999) • Diagnostic delays in cancer do matter, but it is hard to quantify their impact on survival or mortality. (Neal BJC 2009)
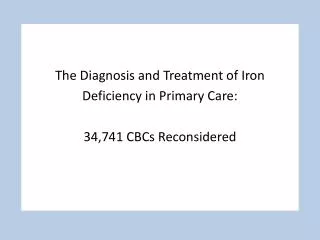
Patient awareness of cancer symptoms (Robb 2009) • Using standardised cancer awareness measures (CAMs) • Awareness lower in BME groups
International Cancer Benchmarking Partnership (ICBP) (Forbes 2013) • Symptom awareness in the UK did not differ from other countries.
International Cancer Benchmarking Partnership (ICBP) (Forbes 2013) • The UK had the highest perceived barriers to symptomatic presentation
Increasing public awareness: impact on lung cancer • National awareness campaign for symptoms of lung cancer; 6 weeks in 2012 • Public awareness of symptoms increased from 41% to 50% • Urgent referrals for suspected lung cancer increased by 30% CRUK analysis of LUCADA data 2013
Lung Cancer: Reported avoidable delays (Rubin/RCGP 2013)
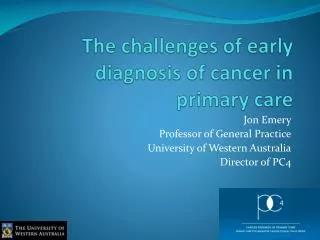
50 40 30 % 20 10 0 Lung Renal Ovary Breast Bladder Prostate Stomach Colorectal Pancreatic Melanoma Leukaemia Lymphoma Endometrial Oesophageal Multiple myeloma GP consultations prior to referral LyratzopoulosLancet Oncology 2012 Comparison of crude (unadjusted) proportion of patients with three or more general practitioner consultations before hospital referral between the NHS Cancer Patient Survey 2010 and the National Audit of Cancer Diagnosis in Primary Care National primary care audit 2009 CPES 2010
Promptness of cancer diagnosis Amongst 13 035 patients with any of 18 different cancers, most (82%) were referred after 1 (58%) or 2 (25%) consultations (median intervals 0 and 15 days, respectively) while 9%, 4% and 5% patients required 3, 4 or 5+ consultations (median intervals 34, 47 and 97 days, respectively) (Spearman’s r=0.70). Box plot for primary care interval by category of number of pre-referral consultations (1, 2, 3, 4 and ‘5+’) for patients with any of 18 cancers (n=13 035). LyratzopoulosBJC 2013
Change in diagnostic intervals2001/02-2007/08 (Neal 2013)http://www.nature.com/bjc/journal/v110/n3/full/bjc2013791a.html
All cancers in England 2007 Routes to Diagnosis
Routes to Diagnosis: Comparing different studies NCIN 2012. All cancers in England 2007
2ww referrals: conversion and detection rates (Meechan 2012) Correlation between Conversion rate and Detection Rate (with lines plotting the median detection rate within deciles of conversion rate and the median conversion rate within deciles of detection rate) MeechanBJGP 2012
Any potential solutions? • Re-establish relational continuity of care: • Small GP teams – Relational continuity of care • Continuity vs access? • Longer consultations – These tend to enable the GP and patient to address the wider patient care agenda and contribute to improved outcomes • Current primary care funding crisis makes this ever more difficult • Information gathering, dissemination and continuity of information • Recognition of the potential for bias/diagnostic error, and strategies to reduce this • Information technology and coding (eg reason for encounter) • Improved safety netting to patients, included documenting in the notes and ensure patient understanding • Audit/feedback • Including SEAs and review of cancer profiles
Change in referral patterns with Risk Assessment Tools (Ablett-Spence et al. Report to NCAT 2012) Colorectal Cancer
Any practice intervention Of the 8134 practices in England, 1160 were removed because of small list size (<1000) or significant change in list size between the two periods. 2129 practices (30% of the England total) participated in one or more of four specified NAEDI initiatives – use of Risk Assessment Tools, criterion based audit, significant event analysis, development of practice plans.
Conclusions • Early cancer diagnosis is complex • Patient, doctor and system factors can all contribute to delay • There remains variation in process and outcomes • In the UK • Between comparable countries • Use of investigations • Gatekeeping and GP/specialist interface • Available pathways for assessment • Variation in practice and quality of care has improved, but there is more to do • Relational continuity of care and information • Further work on risk assesssment tools • NICE 2ww guidelines (2005) often based on “red flag” symptoms: being revisited – due for publication 2015 • Continuing CRUK NAEDI and other related research programmes
Early Cancer Diagnosis in Primary Care:The evolving evidence Thomas Round GP XX Place Tower Hamlets Academic Clinical Fellow KCL thomasround@nhs.net / thomas.round@kcl.ac.uk