Download
1 / 27
270 likes | 441 Vues
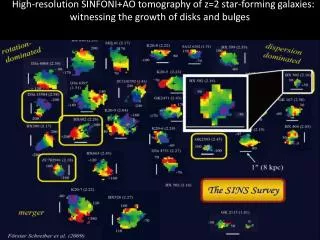
H High -resolution SINFONI+AO tomography of z=2 star-forming galaxies: witnessing the growth of disks and bulges . High-resolution SINFONI+AO tomography of z=2 star-forming galaxies: witnessing the growth of disks and bulges . SDSS v.s . zCOSMOS Yingjie Peng Advisor: Simon Lilly.

E N D
HHigh-resolution SINFONI+AO tomography of z=2 star-forming galaxies: witnessing the growth of disks and bulges
High-resolution SINFONI+AO tomography of z=2 star-forming galaxies: witnessing the growth of disks and bulges
SDSS v.s. zCOSMOS • Yingjie Peng • Advisor: Simon Lilly
SpeczWarning Data values SpecZStatus Data values
SELECT G.objid, G.ra, G.dec, G.type, G.primTarget as G_primTarget, G.flags, G.primTarget & dbo.fPrimTarget('TARGET_GALAXY') as G_TARGET_GALAXY, G.primTarget & dbo.fPrimTarget('TARGET_GALAXY_BIG') as G_TARGET_GALAXY_BIG, G.primTarget & dbo.fPrimTarget('TARGET_GALAXY_BRIGHT_CORE') as G_TARGET_GALAXY_BRIGHT_CORE, G.petroMag_u, G.petroMag_g, G.petroMag_r, G.petroMag_i, G.petroMag_z, G.petroMagErr_u, G.petroMagErr_g, G.petroMagErr_r, G.petroMagErr_i, G.petroMagErr_z, G.modelMag_u, G.modelMag_g, G.modelMag_r, G.modelMag_i, G.modelMag_z, G.modelMagErr_u, G.modelMagErr_g, G.modelMagErr_r, G.modelMagErr_i, G.modelMagErr_z, G.psfMag_u, G.psfMag_g, G.psfMag_r, G.psfMag_i, G.psfMag_z, G.psfMagErr_u, G.psfMagErr_g, G.psfMagErr_r, G.psfMagErr_i, G.psfMagErr_z, G.extinction_u, G.extinction_g, G.extinction_r, G.extinction_i, G.extinction_z, G.petroR50_u, G.petroR50_g, G.petroR50_r, G.petroR50_i, G.petroR50_z, G.petroR90_u, G.petroR90_g, G.petroR90_r, G.petroR90_i, G.petroR90_z, S.mjd, S.plate, S.fiberID , S.z, S.zConf, S.specclass, S.zStatus, S.zWarning, S.primTarget as S_primTarget, S.primTarget & dbo.fPrimTarget('TARGET_GALAXY') as S_TARGET_GALAXY, S.primTarget & dbo.fPrimTarget('TARGET_GALAXY_BIG') as S_TARGET_GALAXY_BIG, S.primTarget & dbo.fPrimTarget('TARGET_GALAXY_BRIGHT_CORE') as S_TARGET_GALAXY_BRIGHT_CORE, (S.zWarning & (dbo.fSpecZWarning('LOC') + dbo.fSpecZWarning('NO_SPEC') + dbo.fSpecZWarning('NO_BLUE') + dbo.fSpecZWarning('NO_RED')) ) as S_zWarning , P1.z as P1_z, P1.zErr, P1.nnIsInside, P1.chiSq, P1.pzType, P1.dmod, P1.rest_ug, P1.rest_gr, P1.rest_ri, P1.rest_iz, P1.kcorr_u, P1.kcorr_g, P1.kcorr_r, P1.kcorr_i, P1.kcorr_z, P1.absMag_u, P1.absMag_g, P1.absMag_r, P1.absMag_i, P1.absMag_z, P2.photozcc2, P2.photozerrcc2, P2.photozd1, P2.photozerrd1, P2.flag, R.fieldQall, R.opdbq into mydb.sdss_dr7_photo_and_spec_1 from Galaxy as G left outer join SpecObj as S on G.objID = S.bestObjID left outer join Photoz as P1 on G.objID = P1.objid left outer join Photoz2 as P2 on G.objID = P2.objid left outer join RunQA as R on G.fieldID=R.fieldID WHERE G.dec>50.0 AND (G.petroMag_r-G.extinction_r)<=18.0 AND ((G.flags_r & 0x10000000) != 0) AND ((G.flags_r & 0x8100000c00a0) = 0) AND (((G.flags_r & 0x400000000000) = 0) or (G.psfmagerr_r <= 0.2)) AND (((G.flags_r & 0x100000000000) = 0) or (G.flags_r & 0x1000) = 0) AND (G.primTarget & dbo.fPrimTarget('TARGET_GALAXY') > 0 OR G.primTarget & dbo.fPrimTarget('TARGET_GALAXY_BIG') > 0 OR G.primTarget & dbo.fPrimTarget('TARGET_GALAXY_BRIGHT_CORE') > 0 OR S.primTarget & dbo.fPrimTarget('TARGET_GALAXY') > 0 OR S.primTarget & dbo.fPrimTarget('TARGET_GALAXY_BIG') > 0 OR S.primTarget & dbo.fPrimTarget('TARGET_GALAXY_BRIGHT_CORE') > 0) -- sdss_dr7_photo_and_spec_1 : G.dec>50.0 -- sdss_dr7_photo_and_spec_2 : G.dec>40.0 AND G.dec<=50.0 -- sdss_dr7_photo_and_spec_3 : G.dec>30.0 AND G.dec<=40.0 -- sdss_dr7_photo_and_spec_4 : G.dec>20.0 AND G.dec<=30.0 -- sdss_dr7_photo_and_spec_5 : G.dec>10.0 AND G.dec<=20.0 -- sdss_dr7_photo_and_spec_6 : G.dec> 0.0 AND G.dec<=10.0 -- sdss_dr7_photo_and_spec_7 : G.dec<= 0.0
Flux: 'PETRO', 'MODEL'‚ SDSS ugriz BESSELL UBVRI kcorrect -Mike Blanton kcorrect - K-corrections in ugriz satisfying m = M + DM(z) + K(z) based on the best fit sum of templates mtol - current stellar mass-to-light ratios from model in each band mass - total current stellar mass from model mets - average metallicity in current stars intsfh - total integrated star formation history absmag - absolute magnitude (for missing data, substitutes model fit). (evolution correction *not* applied) amivar - inverse variance of absolute magnitude chi2 - chi^2 of fit b300 - [ngals] star-formation within last 300Myrs relative to average star-formation rate b1000 - [ngals] star-formation within last 1Gyrs relative to average star-formation rate Fixing collisions
labmda eta lambda
The prob(z) values are tabulated for 100 redshift bins, centered at z = 0.03 to 1.47, with redshift spacing dz = 1.44/99 --------------------------------------------------------------------------- Column What Unit Description --------------------------------- 0 Run SDSS Run number (part of the 5 part run-rerun-camcol-field-obj ID) 1 Rerun SDSS Rerun number (part of the 5 part run-rerun-camcol-field-obj ID) 2 Camcol SDSS Camcol number (part of the 5 part run-rerun-camcol-field-obj ID) 3 Field SDSS Field number (part of the 5 part run-rerun-camcol-field-obj ID) 4 Obj SDSS Obj number (part of the 5 part run-rerun-camcol-field-obj ID) 5 photozcc2 "cc2" photo-z from the photoz2 table in the CAS 6 photozerrcc2 Error on "cc2" photo-z from the photoz2 table in the CAS 7 photozd1 "d1" photo-z from the photoz2 table in the CAS 8 photozerrd1 Error on "d1" photo-z from the photoz2 table in the CAS 9 Flag Integer flag on photo z 10 ObjID SDSS 64-bit unique object id number 11 RA Deg J2000 Right Ascension of object 12 DEC Deg J2000 Declination of object 13-112 prob(z) Photometric redshift probability distribution function for object
SERSIC_AMP[5]: The best fit to the variable "A" in Equation (1) of Blanton et al. (2003), for each band. (nanomaggies/arcsec^2) SERSIC_R0[5]: The best fit to the variable "r_0" in Equation (1) of Blanton et al. (2003), for each band. (arcsec) SERSIC_N[5]: The best fit to the Sersic index "n" in Equation (1) of Blanton et al. (2003), for each band. SERSIC_CHI2[5]: chi^2 for the fit in each band SERSIC_COVAR[2,2,5]: Covariance matrix between SERSIC_R0 and SERSIC_N in the fit for each band. SERSIC_NPROF[5]: The number of profMean annuli used in the fit (see documentation of the radial profile annuli at the SDSS web site) SERSIC_FLUX[5]: Flux in best fit model in each band (nanomaggies) SERSIC_R50[5]: 50% light radius of best fit model in each band (arcsec) SERSIC_R90[5]: 90% light radius of best fit model in each band (arcsec) SERSIC_PETROFLUX[5]: Flux if SDSS Petrosian flux was measured on best fit model in each band (nanomaggies) SERSIC_PETROR50[5]: 50% light radius if SDSS Petrosian measurement was made on best fit model in each band (arcsec) SERSIC_PETROR90[5]: 90% light radius if SDSS Petrosian measurement was made on best fit model in each band (arcsec) SERSIC_CANON_AMP[5]: The best fit to the variable "A" in Equation (1) of Blanton et al. (2003), for each band, using SERSIC_R0 and SERSIC_N fixed at their best fit values for the i-band. (nanomaggies/arcsec^2) SERSIC_CANONFLUX[5]: Flux in best fit in each band using using SERSIC_R0 and SERSIC_N fixed at their best fit values for the i-band. (nanomaggies) SERSIC_CANONPETROFLUX[5]: Petrosian flux in best fit in each band using using SERSIC_R0 and SERSIC_N fixed at their best fit values for the i-band. (nanomaggies) This figure shows a comparison for DR4 data. The x-axis shows the stellar mass from Guinevere's modelling (Kauffmann et al 2003, K03). The y-axis shows the median difference between the K03 mass estimates and those obtained from fitting to the total magnitudes (blue) and to the fibre magnitudes scaled to total (green-ish).
; 0 nn5 with spec z objects only ;flux limited ;zmin=0.01 zmax~0.1 ; 1 edge correction ; 2 nn10 with spec z objects only ; 3 edge correction ; 4 nn5 with spec z objects only ;volume limited Mr=-20 ;zmin=0.02 zmax~0.085 ; 5 edge correction ; 6 nn10 with spec z objects only ; 7 edge correction ; 8 nn5 with spec z objects only ;volume limited Mr=-19 ;zmin=0.02 zmax~0.055 ; 9 edge correction ; 10 nn10 with spec z objects only ; 11 edge correction ; 12 nn5 with spec z objects only ;mass limited mass>10.0 ; 13 edge correction ; 14 nn10 with spec z objects only ; 15 edge correction ; 16 nn5 with spec z objects only ;mass limited mass>10.5 ; 17 edge correction ; 18 nn10 with spec z objects only ; 19 edge correction ; 20 mean density from volume limited Mr=-19 ; 21 mean density from volume limited Mr=-20 ; 22 fiber collision correction ; 23 nn5 with spec z objects only ;volume limited MB=-19.3-z ;zmin=0.02 zmax~0.09 ; 24 edge correction ; 25 nn10 with spec z objects only ; 26 edge correction ; 27 mean density from volume limited MB=-19.3-z ; 28 nn5 with spec z objects only ;volume limited MB=-20.5-z ;zmin=0.02 zmax>>0.1 ; 29 edge correction ; 30 nn10 with spec z objects only ; 31 edge correction ; 32 mean density from volume limited MB=-20.5-z Thanks a lot for Katarina’s advice!
Disentangle Environment & Mass Disentangle Environment & Mass Red in D4 dense Environment efficiency: Red in D1 under dense Density: 5nn, volume limited MB=-19.3-z z=0.02-0.85 Quartile: defined by mass>10.5
Disentangle Environment & Mass Disentangle Environment & Mass Red in D4 dense Environment efficiency: Red in D1 under dense (U-R)rest log( 1+delta) log( 1+delta)
Disentangle Environment & Mass Red in D4 dense Environment efficiency: Define the environment efficiency: ε ε ~ z,delta Red in D1 under dense
Baldry 2006 Define the environment efficiency: ε ε ~ z,delta
Disentangle Environment & Mass z: 0.2-0.5 ε z: 0.5-0.7 z: 0.7-1.0 log mass*
Mass>11.3 Mass>11.3
Mass>11.3 Mass>11.3
Mass>11.3 Mass>11.3
Possible for the 20K sample shear tensor.: eigenvalues of ξij: (λ1, λ2, λ3) shear ellipticity e and prolatenessp: ν = δ/σ = λ1 + λ2 + λ3