
Analyzing Quarterly Quality Metrics: Returns & On-Time Delivery Efficiency
This report examines critical quality metrics for our production process, focusing on customer returns per quarter versus total parts shipped and the percentage of purchase orders delivered on-time by quarter. It includes tooling, molding, and assembly items as part of the evaluation. Furthermore, we discuss internal production efficiency each quarter, highlighting how greater efficiency translates to lower operating costs, resulting in more competitive pricing. The Delta metric illustrates the gap between machine count and finished goods shipped, providing insights into production losses.

Analyzing Quarterly Quality Metrics: Returns & On-Time Delivery Efficiency
E N D
Presentation Transcript
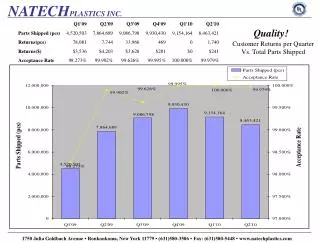
Quality! Customer Returns per Quarter Vs. Total Parts Shipped
On-Time Delivery! Percent of PO’s delivered On-Time by Quarter *Includes tooling, molding, and assembly items
Price! Internal production efficiency per quarter. Greater Efficiency = Lower Cost of Operating = Lower Prices We Can Offer! *Delta is the difference between the machine count, and the finished goods shipped, essentially all production loss.