BA 275 Quantitative Business Methods
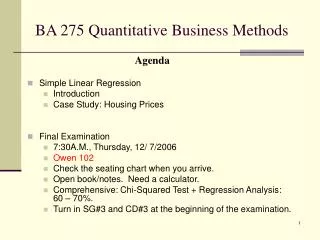
This agenda outlines the final examination for the Quantitative Business Methods course, focusing on analyzing survey data through chi-square tests of independence and contingency tables. The exam is scheduled for Thursday, December 7, 2006, from 7:30 to 9:20 a.m. in Owen 102. Students must be seated in their assigned spots to receive their exam booklets. Comprehensive topics covered include regression analysis and chi-square tests, accounting for 60-70% of the exam. Be sure to bring a functioning calculator and get a good night’s sleep. Check email for additional office hours during finals week.

BA 275 Quantitative Business Methods
E N D
Presentation Transcript
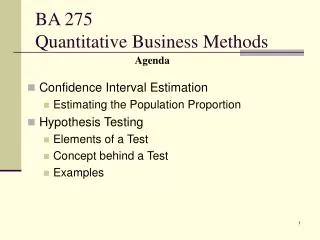
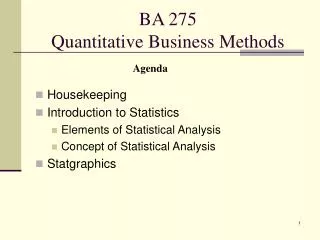
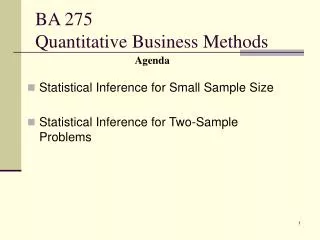
BA 275Quantitative Business Methods Agenda • Analyzing Survey Data • Chi-square Test of Independence • Contingency Tables • Chi-square Test of a Contingency Table
Final Examination • Thursday, 12/07/06 from 7:30 – 9:20 a.m. • Room: Owen 102 • Check the seating chart when you arrive. You must sit in the assigned seat to receive your own exam booklet. • Topics: Comprehensive • Regression analysis and Chi-square test account for 60 – 70%. • Need a calculator that works and a good night sleep. • Check email over the weekend for additional office hours during the finals week.
Analyzing Survey Data • Do you own an iPod? ___Yes ___No • Do you own a flatscreen TV? ___Yes ___No • Which of the following 4 soft drinks gives you the highest satisfaction? • Type A ___ • Type B ___ • Type C ___ • Type D ___ • Your gender: ____Male ____ Female • Your nationality: _____
Chi-square Test H0: The two classifications are independent Ha: The two classifications are dependent What is the marketing implication?
Chi-square Statistic – a measure of similarity/difference Large or small? Implication?
Chi-square Statistic Cutoff Degrees of freedom = (#rows – 1 ) x (#cols – 1) Reject H0 Tables look different Two classifications are DEPENDENT. Tables look similar Do not reject H0 Two classifications are INdependent.
Finally …. Thank you and Good Luck