SEDIMENT DATA-COLLECTION TECHNIQUES
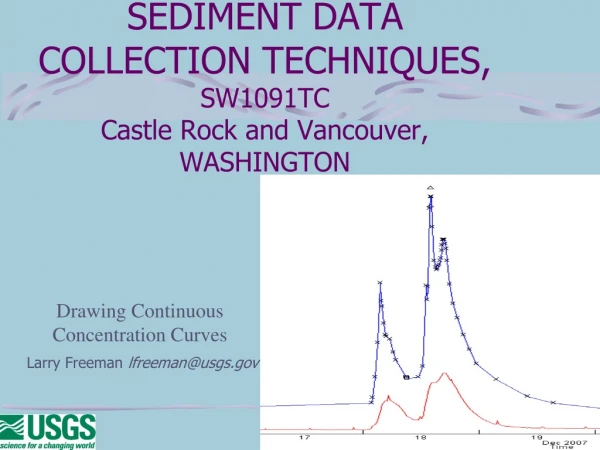
SEDIMENT DATA-COLLECTION TECHNIQUES. SW1091TC CASTLE ROCK AND VANCOUVER, WASHINGTON Sediment Records Data Organization. Larry Freeman lfreeman@usgs.gov. DATA ORGANIZATION FOR COMPUTATION OF DAILY SEDIMENT DISCHARGE. Or “How do I keep it all together?”.

SEDIMENT DATA-COLLECTION TECHNIQUES
E N D
Presentation Transcript
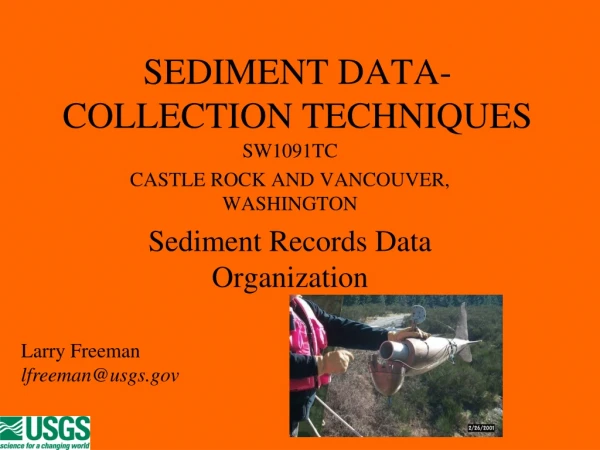
SEDIMENT DATA-COLLECTION TECHNIQUES SW1091TC CASTLE ROCK AND VANCOUVER, WASHINGTON Sediment Records Data Organization Larry Freeman lfreeman@usgs.gov
DATA ORGANIZATION FOR COMPUTATION OF DAILY SEDIMENT DISCHARGE Or “How do I keep it all together?”
DATA ORGANIZATION FOR A DAILY SEDIMENT RECORD STARTS IN THE FIELD
Observer Sampling Instructions. • Frequency of sampling. • Bottle labeling. • Field Office contact information. • Bottle fill range.
Back at the office: • Organize the samples in shipping containers • Enter sample metadata in SedLogin • Print a copy of the SLAR and pack it with the samples. • Ship the samples to the lab.
GET YOUR SAMPLES TO THE LAB AS SOON AS POSSIBLE • AVOIDS PROBLEMS WITH SAMPLES CAUSED BY: • FREEZING • EVAPORATION • BIOLOGICAL GROWTH
GATHER TOGETHER ALL FIELD NOTES (TECH AND OBSERVER) AND CHECK AGAINST LAB RESULTS. • ACCOUNT FOR ALL TECHNICIAN AND OBSERVER SAMPLES. • LOOK FOR INFORMATION DISCREPANCIES BETWEEN FIELD NOTES AND LAB RESULTS, I.E., DATE/TIME, TECH/OBS, EWI/EDI/BOX.
LAB DATA REVIEW • LOOK FOR UNEXPECTED and UNEXPLAINABLE DIFFERENCES BETWEEN SAMPLE SETS. • Do the concentration results compare well? • Do the size analysis results compare well? • SCAN THE LAB RESULTS FOR "OUTLIERS" TO ADJACENT SAMPLE VALUES AND EXPECTED CONCENTRATION TREND.
SURFACE WATER DISCHARGE RECORD MUST BE FINALIZED. • SURFACE WATER RECORD NEEDS TO HAVE BEEN REVIEWED AND APPROVED FOR PUBLICATION AND RECORD SHOULD BE FLAGGED AS “FINAL”. • OTHERWISE YOU COULD BE WASTING TIME!!
FOLLOW A RECORD COMPUTATION CHECKLIST. • THERE ARE MANY STEPS, • BUT THE FOLLOWING ARE THE PRINCIPAL STEPS
MORE STEPS • DETERMINE CROSS-SECTION COEFFICIENTS • An involved topic of it’s own (See John Gray).
PLOT SAMPLES ON TIME-SERIES STAGE OR DISCHARGE RECORD • Manually, using plotting package, or using USGS computational software.
DEVELOP TRANSPORT CURVES. • Plot sample concen-tration vs. water discharge on log/log paper.
TRANSPORT CURVE • Draw a best fit line or lines that balance the samples. • Line may have multiple segments. • Used to estimate sediment concentration for unsampled events.
Example Transport Curve Set. • Label sample points with date or season. • Often there are multiple relationships. • It is very easy to apply curves incorrectly.
LOOK TO THE PAST FOR HELP LOOK AT RECORDS FOR PREVIOUS YEARS. How were storm peaks estimated? What is the typical slope of sedigraph for the rising and falling limbs? How much variation in samples? Is it within normal limits for the site? What is the expected variation in loads from season to season, or for different types of runoff events? Were coefficients previously used? If so, what were they and have they changed? REFER TO LAST YEAR’S STATION ANALYSIS. Any special calculations needed? Other considerations?
There are a variety of methods: By manually subdividing (we’ll do this in a few minutes) Spreadsheets (carefully review the embedded formulas). *GCLAS (USGS approved software). COMPUTE DAILY VALUES OF CONCENTRATION AND SEDIMENT DISCHARGE.
PLOT DAILY SEDIMENT LOAD AND WATER DISCHARGE, OR CONCENTRATION AND WATER DISCHARGE AND COMPARE WITH PREVIOUS YEARS. See the next few slides. EVALUATE DAILY VALUES
STILL MORE STEPS • COMPARE WITH UPSTREAM OR DOWNSTREAM SITES. • Can differences in loads and concentrations be explained? • WRITE STATION ANALYSIS.
STATION ANAYLSIS • DESCRIBE THE SAMPLING PROGRAM • PROVIDE A SAMPLE DATA SUMMARY. • WHAT TYPE OF SAMPLES AND HOW MANY. • FLOW RANGE SAMPLED BY TECHNICIAN AND OBSERVER OR POINT SAMPLER. • DESCRIBE THE SEDIMENT DISCHARGE MEASUREMENTS THAT WERE MADE. • DISCUSS APPLICATION OF CROSS-SECTION COEFFICIENTS.
MORE ABOUT THE STATION ANALYSIS • DESCRIBE HOW THE RECORD WAS COMPUTED, i.e. WHAT SOFTWARE WAS USED. • DISCUSS SAMPLES THAT WERE NOT USED. • DISCUSS ANY ESTIMATED PERIODS. • DISCUSS ANY SPECIAL METHODS USED DURING RECORD COMPUTATION OR DURING FIELD SAMPLING. • SUMMARIZE PARTICLE SIZE ANALYSES. • DISCUSS BED MATERIAL SAMPLING. • DISCUSS BEDLOAD MEASUREMENTS AND COMPUTATIONS. • REMARK ON RECORD QUALITY. • INDICATE WHO PROCESSED THE RECORD.