Download
1 / 7
70 likes | 101 Vues
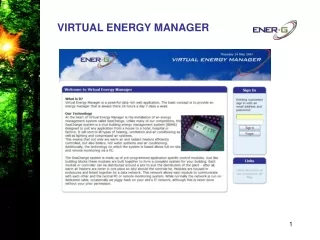
Efficiently manage energy usage with interactive maps, icons for performance indicators, substance summaries, and detailed meter browsing options. Visualize data and target achievements easily to optimize energy consumption.

E N D
SITE SUMMARY PAGE • Alphabetical list of sites • Interactive Google Map • Site summary icons – site performance at a glance • Sort and Filter sites by performance 2
SITE SUMMARY PAGE SUMMARY ICONS • Icons for each energy mode – Budget, CO2, Consumption, Comfort • Icons show increase/decrease on previous period • Icons also show performance against predefined targets • Spending increased • Target not achieved • CO2 footprint decreased • Target not achieved 3
SITE DASHBOARD • Substances summarised in graphical or textual form • Red or Green traffic light indicates attention is required 4
SITE DASHBOARD DRILL DOWN • Shows child meters for a substance • Switch between viewing meters and viewing targets • Summarised in graphical or textual form 5
SITE DASHBOARD METER BROWSER • Browse meters under 3 modes: Consumption, Cost, CO2 • Mini graphs give overview and make irregularities apparent • Full size graphs show detail 6
SITE DASHBOARD COMFORT BROWSER • Coloured squares indicate areas that were outside set temperature • Drill down from a year to a specific day • Detailed graphs show day, week, or month data 7