Understanding Statistics: Making Sense of Data and Its Value in Decision-Making
This section introduces the importance of studying statistics in order to make informed decisions and understand the world. It covers the concepts of individuals, variables, categorical vs. quantitative data, and distributions. Visual tools like bar and pie charts are discussed, along with the essential attributes of good charts. By distinguishing between different types of data and recognizing the limitations of anecdotal evidence, students learn to interpret statistics effectively, which is crucial in various fields of study.

Understanding Statistics: Making Sense of Data and Its Value in Decision-Making
E N D
Presentation Transcript
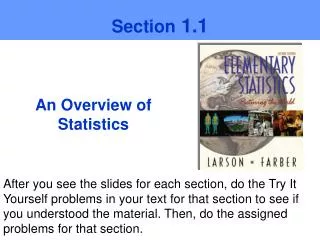
Section 1.1Part 1 AP Statistics CASA CASA, AP Stats 05-06, Section 1.1.1
We study statistics because… • … anecdotal evidence is not reliable. • … we don’t wish to be lied to. • … spotting trends helps us make good decisions • Simply, we study statistics because we want to make sense of the world. CASA, AP Stats 05-06, Section 1.1.1
Vocabulary • Individuals – objects in a data set. Sometimes referred to as x1, x2, x3, etc. • Variable – any characteristic of an individual • Thinking of the individuals in this room, what might some of their characteristics? CASA, AP Stats 05-06, Section 1.1.1
Categorical vs. Quantitative • Categorical variables places individuals in one of several groups. • Quantitative variable takes numerical values for which arithmetic operations like adding make sense. • Of the variables describing the members of the class, which are categorical and which are quantitative? CASA, AP Stats 05-06, Section 1.1.1
Distribution • “The distribution of a variable tells us what values the variable takes and how often it takes these values.” • How distributions differ between categorical and quantitative variables? CASA, AP Stats 05-06, Section 1.1.1
Bar and Pie Charts • Both show relative frequencies of categorical values in a data set. CASA, AP Stats 05-06, Section 1.1.1
Problems with Pie Charts CASA, AP Stats 05-06, Section 1.1.1
Attributes of a “good” chart • Title • Axis Labels • Consistent Scale CASA, AP Stats 05-06, Section 1.1.1
Assignment • Exercises 1.1 – 1.6, Practice of Statistics CASA, AP Stats 05-06, Section 1.1.1