Understanding Production Functions, Total Cost Curves, and Efficient Scale in Economics
This study guide delves into key concepts of production functions, marginal product of labor (MPL), and total cost (TC) curves. It explains how adding more workers affects the MPL, leading to diminishing returns as fixed inputs are shared. The guide outlines the shape of the TC curve, highlighting how TC becomes steeper with increasing output due to rising input costs. Additionally, it covers relationships between average total cost (ATC), average fixed cost (AFC), average variable cost (AVC), and marginal cost (MC) as well as defining efficient scale.

Understanding Production Functions, Total Cost Curves, and Efficient Scale in Economics
E N D
Presentation Transcript
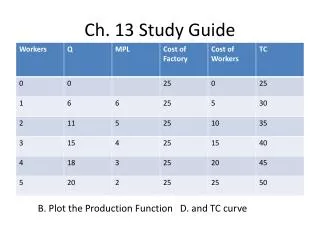
Ch. 13 Study Guide B. Plot the Production Function D. and TC curve
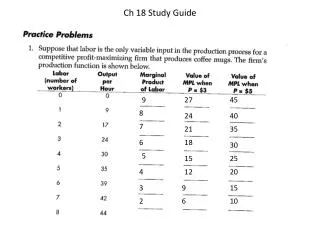
2c. What happens to the MPL as more workers are added to the production facility? Why? Use this information about the MPL to explain the slope of the production function. • MPL decreases as more workers are added • Each worker has to share fixed inputs • As input increases, Q increases but at a slower rate and the slope of production function gets flatter
2e. Explain the shape of the TC curve • As Q increases, and DMP sets in, the TC gets steeper. • In order to produce more Q, the firm must employ greater amounts of input and costs rise at an increasing rate.
3c Explain the shape of curves in 2b • AFC- FC divided by increasing Q so always falling • AVC, ATC, MC : all fall and then rise because of increasing MP followed by decreasing MP • ATC: high at low levels of Q b/c of FC is spread over only a few units; will drop as Q increases; ATC rises because even as AFC falls, AVC rises substantially
3d. Explain relationship between ATC and MC • When MC < ATC, ATC falling • When MC > ATC, ATC rising • MC crosses ATC at min of ATC = Efficient Scale • 3e. Explain ATC, AFC, AVC • ATC = AFC + AVC • Distance between ATC and AVC = AFC; and that distance is always getting smaller