Download
1 / 24
240 likes | 336 Vues
Explore the AMIE Procedure for assimilative mapping of ionospheric electrodynamics using ground and space-based measurements. Understand complex phenomena such as ionospheric convection, energy input to the upper atmosphere, and magnetospheric dynamics through M-I coupling. Analyze data on conductances, auroral precipitation, electric potentials, equivalent currents, and more to map ionospheric electrodynamic fields. Uncover patterns in the Northern and Southern Hemisphere ionospheric convection. Discover the potential drop, Joule heating, energy flux, and field-aligned currents during storm and quiet times. Study AMIE capabilities and limitations for accurate mapping and real-time space weather predictions.

E N D
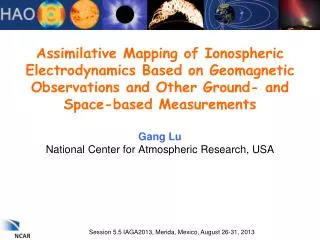
Assimilative Mapping of Ionospheric Electrodynamics Based on Geomagnetic Observations and Other Ground- and Space-based MeasurementsGang LuNational Center for Atmospheric Research, USA Session 5.5 IAGA2013, Merida, Mexico, August 26-31, 2013
Statistical Model F E I J|| DB Fi Ei Ii J||i DBi Statistical Model Satellites Radars IS Radars SP SH Precipitating Particles = S ai IS Radars Magnetic Variations i Satellite Magnetometers Photometic Images Ground Magnetometers Conductances Data The AMIE Procedure (Assimilative Mapping of Ionospheric Electrodynamics) Data Fitted Distributions Fitted Coefficients Basis Functions
The AMIE Procedure (Assimilative Mapping of Ionospheric Electrodynamics) To minimize (with respect to the fitted parameters): Observations Statistical models where
Outputs • Conductances • Auroral precipitation • Electric potential • Equivalent currents • Horizontal currents • Field-aligned currents • Joule heating • Poynting flux The AMIE Procedure (Assimilative Mapping of Ionospheric Electrodynamics) Inputs • Data • Satellites: • electric fields • ion drifts • magnetic fields • precipitating particles • Radars: • ion drifts (IS & HF) • conductances (IS) • Ground Magnetometers • Auroral Photometers: • ground and space based • (e.g., MSP,ASC, UVI, FUV, GUVI) • Models • Auroral Conductances: • Fuller-Rowell & Evans (HP) • Kroehl (equ. Auroral edge) • Hardy (Kp) • Electric Potentials: • Millstone Hill (HP) • Heppner-Maynard (IMF) • IZMEM (IMF) • Weimer (IMF & solar wind)
SuperDARN Maps IS Radars
Energy Flux 103 GW 2002 APR 18 1110 UT Magnetic Field (sate) 2002 APR 18 1110 UT Potential Drop 94 kV 2002 APR 18 1110 UT Space-based Measurements IMAGE FUV CHAMP & Oersted B-field DMSP Ion Drift
Applications of AMIE • Studying Time-Varying Ionospheric Electrodynamic Phenomena • Understanding Magnetospheric Dynamics through M-I Coupling • Providing Realistic Magnetospheric Energy Input to the Upper Atmosphere
onset POLAR UVI Auroral Images on Feb. 11, 2000 00 MLT 18 MLT
@ 2320MLT 0433UT @ 1920MLT 0433UT Pi2 Pulsations on Ground and at Geosynchronous 0433UT
Geotail Observations at (-30,-3,-1.5)RE in GSM 0433UT
Distributions of Field-aligned Current and Auroral Emission
Mapping of Aurora and Convection to the Equatorial Magnetosphere
Quiet Time Storm Time 2003 OCT 29 0030 UT Potential Drop 48 KV 2003 OCT 29 2000 UT Potential Drop 347 KV Joule Heating 123 GW Joule Heating 5215 GW Energy Flux 133 GW Energy Flux 202 GW 2003 OCT 29 0030 UT 2003 OCT 29 2000 UT
Oct 30 1920UT Oct 30 2020UT Oct 30 1820UT 1700 TN (oK) 300 Oct 30 2120UT Oct 30 2220UT Oct 30 2320UT 1700 TN (oK) 300 Difference TN During Storm at ~450 km
CHAMP and TIEGCM Comparison LT=12:57 LT=1:13 CHAMP CHAMP Solar Flare LT=12:57 LT=1:13 TIEGCM TIEGCM Solar Flare LT=12:57 LT=1:13
GRACE and TIEGCM Comparison LT=15:56 LT=3:51 GRACE-B GRACE-B Solar Flare LT=15:56 LT=3:51 TIEGCM TIEGCM Solar Flare LT=15:56 LT=3:51
Acknowledgements Ground MagnetometerChains: 210MM, AGO, BAS, IMAGE, CARISMA/CANOPUS, GIMA, Greenland, INTERMAGNET, MACCS, Russian Arctic and Antarctic, SAMNET, SMALL, Australian magnetometer network SuperDARN IS Radars:Sondrestrom, EISCAT, Millstone Hill DMSP, NOAA, CHAMP, Oersted Satellites, AMPERE Auroral Images from IMAGE, Polar, TIMED, MSPs NCAR CEDAR Database NOAA SPIDR Database NASA CDAW Database The work was supported in part by NASA SRT and GI programs *NCAR is sponsored by the NSF
The AMIE Procedure • Capabilities: • Brings together diverse data sets to obtain a comprehensive, globally coherent picture of ionospheric electrodynamic fields • Provides quantitative estimates of uncertainties in the fitted parameters • Operates with any amount of input data and with flexible temporal resolution • Capable to operate in near real-time for space weather now-cast • Limitations: • Separate treatment of auroral conductances and electric fields • Limited spatial resolution • Accuracy of conductance distributions • Assumption of vertical field-aligned currents • Ignoring neutral wind effects
17:00UT 16:30UT 16:00UT 17:30UT 18:00UT 18:30UT 21:00UT 21:30UT 21:00UT 23:00UT 400 m/s 0 JH (mW/m2) 50 0 ΔTN (oK) 300