Download
1 / 29
290 likes | 309 Vues
This study examines the relationship between stability metrics and low cloud cover variation under climate change, using satellite data and model simulations. It compares the predictive power of different stability metrics and discusses the discrepancies in low cloud changes between SST+2K and 2xCO2 simulations.

E N D
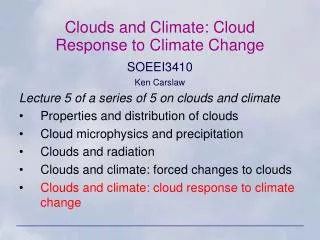
Towards stability metrics for cloud cover variation under climate change Rob Wood, Chris Bretherton, Matt Wyant, Peter Blossey University of Washington
Stability and low clouds, history • Slingo (1980) • Used model potential temperature lapse rate between ~700 and ~850 hPa as predictor of subtropical low cloud cover • Cloud data from satellites (Miller and Feddes 1971)
Stability and low clouds, history • Klein and Hartmann (1993) • Used potential temperature difference between 700 hPa and the surface (“lower tropospheric stability”) as predictor of subtropical low cloud cover • Cloud data from volunteer ship observations (Warren cloud atlas)
Stability, low cloud, and climate change • Miller (1997) thermostat hypothesis: • Static stability expected to increase in warmed climate • Cloud amount vs stability relationships indicate more cloud • Negative cloud feedback • Is LTS a suitable predictor of cloud responses to climate change?
Inversion strength and stability Wood and Bretherton (2006) • In the free-troposphere, d/dz=FT follows a moist adiabat from 700 hPa to the MBL top. • Well mixed surface layer below the LCL, i.e. d/dz=0 • In the cloud layer, d/dz=CL follows a moist adiabat from the top of the LCL to the MBL top. ∆
EIS, a measure of inversion strength ∆ ∆=(700 – 0) –FT(z700 – zi) – CL(zi – zLCL) = (700 – 0) + zi(FT – CL) – FTz700+CLzLCL (a) Neglect term with zi as this term is generally small (b) Replace FT and CL with a single moist adiabat850=m([T0+T700]/2, 850 hPa) (c) Assume surface RH of 80% to estimate zLCL Then define an estimated inversion strength (EIS) as EIS = LTS –850(z700 – zLCL) EIS solely a function of surface and 700 hPa temperatures for a reference surface pressure p0=1000 hPa
LTS/EIS and low cloud amount Subtropical and tropical Midlatitude
LTS/EIS and low cloud amount Subtropical and tropical Midlatitude EIS is a far better predictor of low cloud amount than LTS over a wider temperature range
Change in LTS (K) Low cloud amount in an ensemble of 2xCO2-control GCM simulations is poorly estimated using LTS’ (for which a general increase is predicted)Much better agreement with change in saturated stability (related to EIS’) Williams et al. (2006)
Multiscale approach to the problem • We use a suite of model simulations • Climate model runs from CAM and GFDL (SST+2K and 2CO2/SOM, Wyant et al. 2006) • SP-CAM global run with SST+2K (Wyant et al. JAMES) and 4CO2/fixed SST change. • CRM and LES runs using forcings derived from SP-CAM simulations for different stability percentiles (Blossey et al. JAMES) • Uses only data from tropics (30oS-30oN)
Cloud amount vs LTS (SST+2K) Klein and Hartmann SST+2K control
Cloud amount vs EIS (SST+2K) Wood and Bretherton
EIS and cloud changes The three models studied here have significant increases in EIS However, most climate models show decreasing SWCF in the tropics in AR4 runs Why the discrepancy? from Bony and Dufresne (2005)
SST+2K vs 2xCO2/SOM Somewhat weaker low cloud changes for 2xCO2 runs
SST+2K vs 4xCO2/fixed SST (SP-CAM) Completely different low cloud changes for 4xCO2 runs
MBL depth for control and perturbed runs SST+2K MODIS Obs N×CO2 MBL depth decreases despite reduced subsidence from CO2 FT warming MBL turbulence weakens
Conclusions, SST+2K • CAM3, AM2, and SP-CAM under SST+2K show large LTS increases while low cloud cover changes increase more slowly than predicted by LTS • These models under SST+2K all show increases in EIS too. Cloud changes in CAM and SP-CAM increase somewhat more rapidly than predicted by EIS • CRM driven by SP-CAM output consistent with SP-CAM • LES driven by SP-CAM output not consistent with SP-CAM
Conclusions • Cloud responses to changing CO2 very different from those due to SST changes, even in slab-ocean models. CO2 induces additional atmospheric radiative forcing at the top of the MBL in addition to warming the surface. • CO2 perturbs the relationship between MBL depth and EIS whereas SST+2K does not • MBL depth changing for a given EIS consistent with cloud changes even at constant EIS • Hypothesize that a single metric may be insufficient to capture the low cloud changes from radiative forcing by CO2 and from increased SST.
Doubling CO2 stabilizes lower troposphere independent of SST changes • Standard tropical profile, Fu-Liou RT model
A possible two-metric phase space low cloud cover increasing N×CO2 with SST free trop. rad. heating/LW down changes N×CO2 fixed SST SST+2K EIS, stability-driven changes
Why different sensitivity for SST+2K vs NxCO2? Models all show decreasing MBL depth (defined as 50% RH level) with increasing stability
Comments on previous • CRM forced from SP-CAM has larger low cloud amounts, while LES gives much smaller cloud amounts than parent model. • SWCF for CRM similar to that from parent model, while LES is still much weaker • Climate changes in CRM similar to that in parent model
Comments on previous • All models show decreasing MBL depth with increasing EIS • SST+2K runs tend to deepen MBL depth or stay same whereas NxCO2 runs tend to result in shallower boundary layers. • The SP-CAM results particularly troublesome to interpret as 4xCO2 run shows huge decreases in MBL depth but much weaker cloud cover changes. So increased CO2 results in shallower MBL but with lower cloud cover. • Could this be explained by methodology for compositing (i.e. using percentiles)?
SWCF vs LTS and EIS LTS EIS
Comments on previous • LTS better predictor of current climate model cloud cover than EIS • Increases in LTS are large in all models (1K). Corresponding increases in low cloud cover are roughly consistent with KH93 for CAM and SP-CAM, but clouds decrease in AM3 despite large LTS increases • Increases in EIS are seen in all models but these are much weaker than LTS increases (order 0.3-0.5K). CAM3 and SP-CAM cloud cover increases more strongly than expected from low cloud-EIS relationship of Wood and Bretherton. • Similar conclusions drawn for SWCF vs LTS/EIS