Download
1 / 29
290 likes | 434 Vues
Changes in Michigan Automotive Industry Employment. Bernard Swiecki Industry Analyst Economics and Business Group Center for Automotive Research February 28, 2002. Contribution of the Auto Industry to the U.S. Economy in 1998: The Nation and Its Fifty States.

E N D
Changes in Michigan Automotive Industry Employment Bernard Swiecki Industry Analyst Economics and Business Group Center for Automotive Research February 28, 2002
Contribution of the Auto Industry to the U.S. Economy in 1998: The Nation and Its Fifty States Performed by CAR for the Alliance of Automobile Manufacturers Winter 2001
1998 Automotive Compensationper Employee Avg. Payroll Avg. Benefits 120,000 $102,856 $96,360 $93,184 100,000 25,951 29,776 80,000 31,647 Compensation 60,000 40,000 76,905 61,537 66,584 20,000 0 Salaried Hourly Total Source: Company surveys
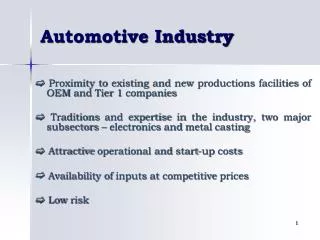
Vehicle Firms: Manuf. Supplier Empl.: New Dealer Empl.: Dealer Supplier Empl.: Spin-off Empl.: Total Empl.: Total Compensation 260,400 274,400 28,900 21,700 422,100 1,007,500 $44.7 bil. 1998 Michigan Automotive Employment: Alliance Study
1998 Michigan Automotive Employment - Survey Vehicle Firms: Parts and Component Firms: Pre-production Firms: Other Manufacturing: Business Services: Wholesale Trade: 260,444 119,643 88,332 ? ? ?
Michigan Ohio California Illinois Missouri South Dakota Alaska 1,007,500 630,800 462,900 311,900 221,200 14,000 4,600 Jobs Contributed Across the 50 States
($ thousands 1996) 44 52 Lumber and wood products 56 Textile mill products 56 Leather and leather products 61 Misc. Manufacturing industries 68 Fabricated metal products 72 Rubber and misc. plastic products 73 Printing and publishing 86 Stone, clay, and glass products 88 All Manufacturing 93 Industry machinery and equip. 94 Primary metal industries 101 Paper and allied products 114 Food and kindred products 117 Electronics; other electronic equip. 118 Instruments and related products 119 Transportation equip. 120 Motor vehicles and equipment 137 Chemicals and allied products 235 Petroleum and coal products 298 Tobacco products 823 0 100 200 300 400 500 600 700 800 900 Dollars (Thousands) 1996 Value Added per Employee Apparel and other textile products Furniture and fixtures Source: U.S. Census Bureau, 1999 Statistical Abstract of the United States, p. 748.
Hourly Salaried Salaried Percent of Employment 700,000 35.0% 623,133 600,000 30.0% 30.2% 442,708 500,000 25.0% 23.7% 380,682 400,000 20.0% Employment 300,000 15.0% 10.4% 164,344 200,000 10.0% 137,264 72,320 100,000 5.0% 0 0.0% 85 95 98 Year Source: Company Reports Big 3 U.S. Employment Percent Salaried
Big 3 Michigan Employment Employment Percent Salaried Source: Company Reports
Michigan: The High Technology Automotive State Performed by CAR for the MEDC April, 2000
Motor vehicles & motor vehicle equipment Office, computing, & acctg. machines Drugs and medicines Computer & data processing services Electronic components Trade Communication equipment Aircraft & missiles Other machinery, except electrical Optical, surgical, photographic & other inst. R & D Spending by Industry - 1997Motor Vehicle is 1st of 39 Major U.S. Industries Source: National Science Foundation/SRS, Survey of Industrial Research and Development: 1997
States Ranked by IndustrialResearch & Development - 1997Michigan Ranked 2nd of the 50 States CALIFORNIA MICHIGAN NEW JERSEY NEW YORK MASSACHUSETTS TEXAS WASHINGTON PENNSYLVANIA ILLINOIS OHIO Source: National Science Foundation
Engineers, Math and Computer Scientists Engineering Technicians Science Technicians Computer Programmers High-Tech Occupations
Big ThreeTechnology Employment Questionnaire Results Total 1998 Auto Employment High-Tech Auto Employment U.S. Michigan Michigan % 492,887 47,548 235,807 37,489 47.8% 78.8%
Michigan All other states 1998 Big ThreeTechnology Employment Questionnaire Results 492,887 (U.S.) 47,548 (U.S)
Michigan 15.9% 1998 Big ThreeTechnology Employment Questionnaire Results High-Tech Employment as Percentage of Total Auto Employment Other states 3.9%
Michigan 1998 Big ThreeTechnology Employment Questionnaire Results Other states
But 1.2 million Americans have been forced into part time work And 20-25% of Tooling and Small Manufacturing Firms will fail by summer Wages are falling, Pensions are Disappearing, and Health Insurance for the Nation may be seriously reduced . . . No Investment . . .And a Record Trade Deficit Well, the Unemployment Rate is Only 5.6%. . .and Things are Looking Up . . .by Summer
1.6 Million Jobs Gone!Manufacturing Jobs and the Trade Deficit: 1980-2000 $-25.5 bil. 12.6 mil. 14.2 mil. $-449.5 bil.
No Connection Between Productivity and Growth in Manuf. Wages: 1981-2000
Premium for Automotive Labor?Relative Auto Wages 1959 - 2000 66% $24.59 28% $14.84 $2.80 $2.19 Source: BLS
1995 1998 60 50 41.58 36.7 40 29.25 26.55 27.49 $/Hr. 30 23.38 20.81 20.5 19.63 16.5 20 10.85 7.75 7.06 6.68 10 2.94 2.51 0 U.S. U.K. Korea Japan Taiwan Mexico Canada Germany 16 ¢/Hr. in India!1998 and 1995 Total Compensation/Hr. for Motor Vehicle Manuf. Production Workers in Selected Countries
Where Did 400,000 Jobs Go?U.S. Auto Parts Imports1990 – 2001Billions of Current Dollars Source: USDOC/ITA
HONDA EAST LIBERTY I-75 I-65 HONDA MARYSVILLE HONDA-LINCOLN SUBARU-ISUZU I-70 TOYOTA Alabama Mississippi NISSAN MERCEDES-VANCE International AutomotiveSupplier andManufacturer Locations NISSAN-CANTON
New Employment Spartanburg, S.C. Lincoln, AL Lincoln, AL Vance, AL Canton, MS Decherd, TN Gibson County, IN Huntsville, AL 1,400 2,000 ? 2,000 4,000 1,000 2,000 350 ? ? $600 $935 $600 $800 ? 60,000 120,000 120,000 eng - 80,000 200,000 200,000 200,000 ? 860,000 Investment($ Millions) NewCapacity Company Location New International Assembly Facilities 2001-2003 BMW-Expansion Honda-Odyssey Odyssey-Engine Mercedes-Benz- Expansion Nissan-Truck Nissan-V8 Engine TMM-Indiana Expansion Toyota V8 Engine New Vehicle Total
International Automotive NA Truck Incremental Capacity 2006 2.1 million units 2005 VW AAC +75K; MB Tall Wag +50K 2004 Sienna +25K; Highlander +75K; Scenic +50K Nissan FS PU +100K, SUV +50K, I/SUV +25K Quest +25K; Honda FS PU +100K, FS SUV +50K 2003 Toyota Matrix +75K; RX300 +50K Tracker –50K; Honda MAV +75K; Odyssey +50K 2002 Honda SUV +100K; Subaru ST/X +25K 2001 1.0 million units Source: CSM Worldwide
Michigan has done well in attracting high paying, desirable automotive employment, but… Needs to do better in attracting it from foreign vehicle firms and suppliers Despite impressive productivity improvements, manufacturing jobs have suffered A Few Conclusions