Download
1 / 11
120 likes | 211 Vues
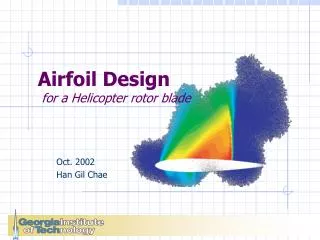
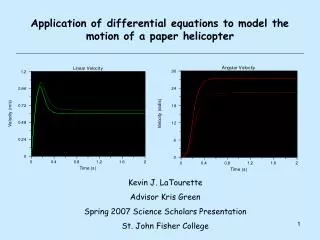
This research explores modifying paper helicopter design to optimize flight duration, aiming to introduce basic physics principles affordably. The study includes methods, statistical analyses, results, interpretation, and conclusions based on experiment outcomes.

E N D
Improving the Design of a Paper Helicopter Oscar Pineda-Catalan The New York Academy of Sciences
Table of Contents (1 slide) Introduction Background Research Question Hypotheses Methods Experimental Design Statistical Analyses Results Analysis & Interpretation Conclusions References Acknowledgements
Introduction(2–3 slides)Provide relevant background information, define your research question, and state your hypothesis. Background • Need for simple, affordable activity to teach students in low resource areas basic principles of physics Research Question • Is it possible to modify the design of a paper helicopter to maximize it’s flight time?
Introduction(2–3 slides)Provide relevant background information, define your research question, and state your hypothesis. Hypothesis Tested • Paper helicopters built using a modified design fly longer than those built using a standard design.
Methods(1–2 slides)Describe the experiment(s) you designed to test your hypothesis, and any statistical analyses you conducted. Example Data Set: Flight time collected from 10 helicopters of each design Two-sample t-test to compare average flight times of each design H0: Average (𝝻) flight time of helicopters built using original design ≥ 𝝻 flight time of helicopters built using new design Ha: 𝝻 flight time of helicopters built using original design < 𝝻 flight time of helicopters built using new design t-test at 95% confidence level (𝜶 = 0.05) and 18 degrees of freedom (𝝼)
Results(2–3 slides)Present the results of your experiment(s) without interpretation. Example
Results(2–3 slides)Include graphs that show your results and facilitate comparing your control and experimental groups. Example
Analysis & Interpretation (2–3 slides)Interpret your results. Example • On average, helicopters built using the original design flew longer than helicopters built using the new design. • Given the results obtained, the null hypothesis cannot be rejected.
Conclusions(1–2 slides)State your strongest results, and explain how you interpret them. Example Based on the samples of helicopters analyzed in this experiment, we cannot conclude that the new design produces helicopters that fly longer than the original design. However, the samples were small, with only 10 helicopters of each design tested. Larger samples should be analyzed to obtain more accurate flight times for each design.
References(1 slide) List the references you used. (Alternatively, you may include references as citations or footnotes in your slides.) Andersson, Ö. (2012). Chapter 8: Statistics for Experiments. In: Andersson, Ö. Experiment! Planning, Implementing and Interpreting. Wiley, pp. 139–174.
Acknowledgements(1 slide) Be sure to thank anyone who helped you conduct your experiment(s)! I would like to thank: The New York Academy of Sciences My Instructor Others