Download

1 / 14
140 likes | 277 Vues
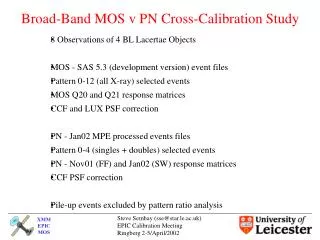
Broad-Band MOS v PN Cross-Calibration Study. 8 Observations of 4 BL Lacertae Objects MOS - SAS 5.3 (development version) event files Pattern 0-12 (all X-ray) selected events MOS Q20 and Q21 response matrices CCF and LUX PSF correction PN - Jan02 MPE processed events files

E N D
Broad-Band MOS v PN Cross-Calibration Study 8 Observations of 4 BL Lacertae Objects MOS - SAS 5.3 (development version) event files Pattern 0-12 (all X-ray) selected events MOS Q20 and Q21 response matrices CCF and LUX PSF correction PN - Jan02 MPE processed events files Pattern 0-4 (singles + doubles) selected events PN - Nov01 (FF) and Jan02 (SW) response matrices CCF PSF correction Pile-up events excluded by pattern ratio analysis
Analysis Method: Define non-piled-up annulus from MOS1 data (use same for MOS2, pn). Generate appropriate arf correction files. Extract source and background spectra (although background mostly negligible) in the 0.2-10 keV band. Fit phabs * bknp model to MOS2 data…fold model through MOS1, MOS2 and pn instrument response. Fit phabs * bknp model to pn data…fold model through MOS1, MOS2 and pn instrument response. Examine DATA/MODEL ratio plots for trends. Examine best-fit model parameters to instruments fitted individually.
+20% Ratio Plot: DATA/MODEL MOS1 MOS2 PN +5% -5% -20% +20% Smoothed: MOS1 MOS2 PN +5% -5% -20%
Effect of Q20 to Q21 PKS2155 0362 15-40 SW Med/Med CCF-PSF Q20 Q21
Calibration of MOS1 Thick Filter PKS2155 0362 15-40 SW Thick/Med
MS0737 0063 0-26 FF Thin/Thin/Thin MS1299 0082 0-44 FF Thin/Thin/Thin
Mrk421 0165 8-44 SW Med/Med/Thick Mrk421 0171 18-44 SW Med/Med/Thick
0-26 Thin Thin Thin Trends due to PSF ? 8-44 Med Med Thick 18-44 Med Med Thick 15-40 Med Med 18-44 Thin Thin Thin 15-40 Thin Med Med --- CCF-PSF Corrected
Comparison of CCF and LUX PSF correction 8-44 15-40 18-44 LUX PSF CCF PSF
Interim Conclusions Q20 - Q21 increases relative difference between model fits to MOS1 and MOS2 data in the high energy band. Q21 residuals better than Q20 in 2-3 keV band. Both MOS and PN show consistent residual features at different energies indicating narrow band calibration problems. MOS1 Thick filter calibration is incorrect. Energy correction due to PSF creates an increasing discrepancy between MOS1 and MOS2 as extraction radius increases. There is a systematic broad band difference between MOS and PN which is independent of Mode/Filter/Extraction radius. What do the spectral parameters tell us ?
Spectral FitParameters: NH Γ1 EB Γ2 χ2υ MS 0737 NH = 3.2e20 z = 0.315 PN Thin 3.60 (0.07) 1.63 (0.20) 0.64 (0.05) 2.35 (0.03) 0.99/475 MOS2 Thin 4.92 (0.10) 2.21 (0.05) 1.72 (0.90) 2.25 (0.05) 1.08/165 PKS 2155 NH = 1.36e20 z = 0.116 PN Med <0.25 2.09 (0.05) 0.73 (0.02) 2.82 (0.02) 1.38/720 MOS2 Med 1.36 (0.25) 2.66 (0.04) 1.59 (0.20) 2.90 (0.05) 1.22/266 Mrk 421 NH = 1.6e20 z = 0.031 PN Thick 0.89 (0.15) 1.77 (0.04) 0.69 (0.01) 2.59 (0.01) 1.37/1191 MOS2 Med 1.33 (0.15) 2.37 (0.02) 1.82 (0.11) 2.55 (0.03) 1.39/404