Download
1 / 55
550 likes | 656 Vues
Model Comparison for short-term growth projections on a Western Oregon property. GMUG Meeting June 2, 2010. G&Y Models Survey. *. 15 Respondents (Industry + TIMOs + Consultants), multiple responses allowed. G&Y Model Used Percent SPS/FPS 8 28% FVS 7 24% ORGANON 5 17%

E N D
Model Comparisonfor short-term growth projections on a Western Oregon property GMUG Meeting June 2, 2010
G&Y Models Survey * • 15 Respondents (Industry + TIMOs + Consultants), • multiple responses allowed G&Y Model Used Percent SPS/FPS 8 28% FVS 7 24% ORGANON 5 17% In-House 5 17% Other 2 7% Excel 1 3% DFSim 1 3% * PACIFIC NORTHWEST TIMBERLAND INVESTMENT SURVEY RESULTS, MARCH 2010, SIZEMORE & SIZEMORE, INC.
Western Oregon South of Portland, North of Eugene Stands in Valley & up west slope of Cascades Data - Location
Data - Remeasurement Count of Plots:
Site Classes * Prior to 1997, SI class assigned based on growth rings
4,382 trees across 15 species DF (3,469), WH (604) Tree Statistics
SIS (SPS) FPS (v6.73) FVS (12/16/2008) PN, WC ORGANON (v8.2) NWO, SMC Growth Models
SIS (SPS) Client coefficient file FPS Library 11 FVS Max SDI: DF 600, WH 720, RA 300 ORGANON (v8.2) Max DF SDI = 600 Growth Models - Options
Measured vs. Predicted Average Growth Basic Error Statistics Error CDF’s Error Significance Tests Linear Regressions of Errors 50-Year Growth Projections Comparison Methods
Period length is not uniform across plots The same set of data was used across models Relative size of errors important Comparison Caveat
High level view of growth PAI Focus on four youngest age classes due to sample size Measured vs. Predicted Average Growth
Performance? SIS, PN, FPS, NWO all about same so far SMC not as good WC least accurate so far Measured vs. Predicted Average Growth
Basic Error Stats - Stands • Errors: Predicted - Observed • Negative = under-prediction • Positive = over-prediction • Errors not annualized** • Stand-level and Tree-level • FPS – no grown treelist output
Basic Error Stats • Performance? • SIS smallest mean errors for all but BA (2nd smallest) and average variability • PN probably second best choice • NWO was least variable • SMC and WC falling out of the race
Error CDF’s - Stand • Cumulative Distribution Functions • Picture of error distribution by error size • More information than a mean bias
Error CDF’s - Tree • Performance? • NWO and SIS had largest % of small errors • FPS and SMC next best, with PN close behind • WC doesn’t seem to be a good fit
Significance Tests • Paired t-test vs. Wilcoxon signed rank test • All data • 5-7 yr vs. 8-10 yr Projections • Initial Vol <= 25 MBF vs. Initial Vol > 25 MBF • Unthinned vs. Thinned
Significance Tests • Performance so far? • Shorter projections generally better (higher p-values) • Less significance in higher volume stands than lower • Thinned vs. unthinned unclear • SIS and PN least significant differences, followed by NWO
Simple Linear Regression • Oi = β0 + β1*Pi + εi • Nature of the bias if it is present, telling us whether it is constant or changing and to what degree.
SLR Results Significance at α = 0.05
SLR Results • Performance so far? • NWO did best, especially when recall low variability • FPS and SMC the next best • SIS and PN several significant slopes and intercepts
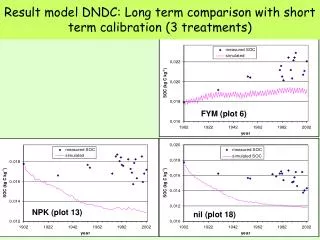
Long-Term Projections • Long-term remeasurement data uncommon • Grow young stands and plot against older inventory data • Less for identifying a ‘best’ so much as pointing out models to avoid