Download

1 / 12
130 likes | 255 Vues
Bojac 1A. Wickham 4A. Wickham 3A. Bojac 2A. Methods to Improve N Fertilization in Virginia. Virginia Polytechnic Institute and State University. Spatial Variability in Soils. Yield ranged from 218 to 9,598 lb/acre at a resolution < 9 ft 2. Estimate tiller density at GS 25.

E N D
Bojac 1A Wickham 4A Wickham 3A Bojac 2A Methods to Improve N Fertilization in Virginia Virginia Polytechnic Institute and State University
Spatial Variability in Soils Yield ranged from 218 to 9,598 lb/acre at a resolution < 9 ft2
Estimate tiller density at GS 25 Willing to split spring N applications? YES YES Tiller density < 100 tillers ft-2? Obtain tissue test at GS 30 Apply N as recommended at GS 30 Apply N as recommended at GS 25 Virginia Sensor-Based Research • Site-specific, split-spring fertilization strategy • Can GS25 tiller counts and GS30 tissue testing be accomplished indirectly using sensor-based spectral measurements collected at a sub-meter resolution?
Warsaw New Kent (7) Painter (13) Culpeper Port Royal Stuarts Draft Chatham Suffolk (8) EXPERIMENTAL SITES 1999-2003
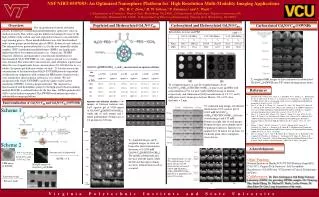
New Kent 2000 Painter-TS 2000 0.9 Port Royal 2000 0.8 Suffolk-TS 2000 Warsaw 2000 0.7 Chatham 2001 0.6 Culpeper 2001 NDVI 0.5 Painter 2001 Painter-AR 2001 0.4 y = 0.22 + 0.00045x (x<joint) y = 0.75 (x>joint) joint = 116 r2 = .78 Painter 2000 0.3 Painter-TD 2001 Painter-TS 2001 0.2 Painter-WR 2001 0.1 Stuarts Draft 2001 0 Suffolk 2001 0 50 100 150 200 Tiller Density, tillers ft-2 NDVI vs TILLER DENSITY
INSEY vs. YIELD 8 Virginia; 8 site years y = 0.5415e367.45x r2 = 0.53 7 Oklahoma; 16 site years 6 y = 0.74076 + 0.1021e577.66x r2 = 0.64 5 Yield, Mg ha-1 4 3 2 1 0 0 0.001 0.002 0.003 0.004 0.005 0.006 0.007 INSEY
RESPONSE INDEX RI-NDVI = NDVIGS30 (Non-Limiting) / NDVIGS30 (Check) RI-Harvest = Yield (Non-Limiting) / Yield (Check)
INSEY vs. YIELD 8 Virginia; 8 site years y = 0.5415e367.45x r2 = 0.53 7 Oklahoma; 16 site years 6 y = 0.74076 + 0.1021e577.66x r2 = 0.64 5 Yield, Mg ha-1 4 3 2 1 0 0 0.001 0.002 0.003 0.004 0.005 0.006 0.007 INSEY
RINDVI NDVIGS30 (0-N Check) NDVIGS30 (Non-Limiting) NDVIGS30 (Field) * RINDVI INSEY YPN Actual Yield YP0 * RINDVI NDVIGS30 * RINDVI Mg ha-1 4.24 2.88 3.96 r2 0.41 0.42 RESPONSE INDEX - VA • Instead of using RINDVI to adjust YP0 to YPN, adjust NDVIGS30 and go directly to YPN
Actual Yield YP0 * RINDVI NDVIGS30 * RINDVI NDVIGS30 * (RI+ΔNDVI) Mg ha-1 4.24 2.88 3.96 4.40 r2 0.41 0.42 0.61 RESPONSE INDEX - VA INSEY = {NDVIGS30 * [RINDVI + ΔNDVI]} / DAP
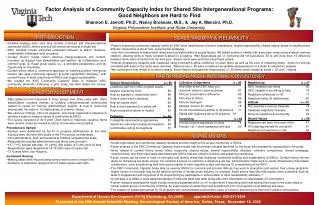
Virginia Research Results N Rate Method Yield 0 Check 45 100 Fixed 80 40-60 Standard 84 40-50 Sensor 91 7 bu/ac Increase 10 lb N/ac Decrease • NUE = 61%