Sample
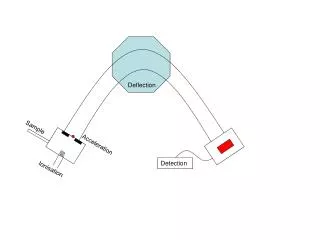
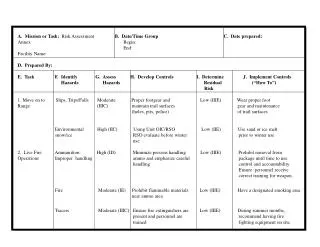
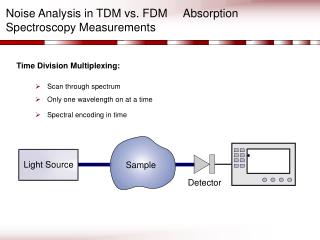
Noise Analysis in TDM vs. FDM Absorption Spectroscopy Measurements. Time Division Multiplexing:. Scan through spectrum Only one wavelength on at a time Spectral encoding in time. Light Source. Sample. Detector. Noise Analysis in TDM vs. FDM Absorption Spectroscopy Measurements.

Sample
E N D
Presentation Transcript
Noise Analysis in TDM vs. FDM Absorption Spectroscopy Measurements Time Division Multiplexing: • Scan through spectrum • Only one wavelength on at a time • Spectral encoding in time Light Source Sample Detector
Noise Analysis in TDM vs. FDM Absorption Spectroscopy Measurements Frequency Division Multiplexing: • All wavelengths on all the time • Spectral encoding in frequency • Wavelengths modulated with unique frequency • Demodulation with FFT or Lock-In Amplifier Light Source Sample Detector FFT
Noise Analysis in TDM vs. FDM Absorption Spectroscopy Measurements In this project: • Implementation of a general TDM and FDM system in LabVIEW • Modular coding of noise sources • Noise library • Detector library • Comparison of TDM and FDM performance • Same conditions (#wavelengths, wavelengths, avg. power, measurement time, linewidths, absorption levels, hardware) • Minimal detectable absorbance (MDA) • Differences in noise levels • Tracking of dynamic events