Download
1 / 75
750 likes | 785 Vues
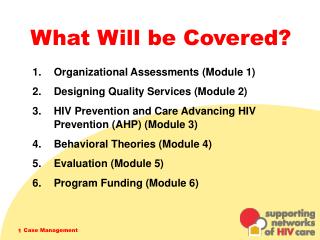
Module ½: The First Day of School. 1. Course Outline. Basic Economic Concepts Measurement of Economic Performance National Income and Price Determination Financial Sector Inflation, Unemployment and Stabilization Economic Growth and Productivity International Trade and Finance. 8-12%

E N D
Module ½: The First Day of School 1
Course Outline • Basic Economic Concepts • Measurement of Economic Performance • National Income and Price Determination • Financial Sector • Inflation, Unemployment and Stabilization • Economic Growth and Productivity • International Trade and Finance • 8-12% • 12-16% • 10-15% • 15-20% • 20-30% • 5-10% • 10-15% 2
Staying Connected www.edmodo.com 3
Staying Connected • http://rossgraham.woodbridge.site.eboard.com 4
School Wires • http://www.woodbridge.k12.nj.us//Domain/682
Homework • Sign up for Edmodo, join our group • Group code-dvjrd8 • Have all class materials and cover your books
Do Now. • At many cash registers there is a little basket full of pennies. People are encouraged to use the basket to round their purchases up or down. If an item costs $5.02, you give the cashier $5.00 and take two pennies from the basket to give to the cashier. If an item costs $4.99, you pay $5.00 and the cashier throws a penny into the basket. It makes everyone’s life a bit easier. Of course, it would be easier still if we just abolished the penny, a step that some economists have urged. • But why do we have pennies in the first place? If it’s too small a sum to worry about, why calculate prices that precisely?
AP Macroeconomics Mr. Graham Unit One Basic Economic Concepts
Module 1: The Study of Economics 11
Individual Choice:The Core of Economics • Economics • The study of how people allocate their limited resources to satisfy their unlimited wants • The study of how people make choices 12
Overview of economic “choices” Made by… Consumers and Producers based on… Needs and Wants for… Goods and Services obtained through… Production (i.e. Resources) 2-13
Who makes economic choices? Made by… Consumers The people who decide to buy things. Producers The people who make the things that satisfy consumers’ needs and wants. 2-14
How do consumers and producers make decisions? …based on… Needs To economists, the term need is not objectively definable. Perhaps the best way to view needs is as an absolute necessity to stay alive. Wants (Desired) goods and services on which we place a positive value People have unlimited wants. 2-15
…for… Goods Goodsare all things from which individuals derive satisfaction or happiness. Services Tasks that are performed for someone else Can be referred to as intangible goods How do consumers and producers make decisions? 2-16
…obtained through… Production Any activity that results in the conversion of resources into products that can be used in consumption Resources (a.k.a.) Factors of Production Inputs that are used to produce things that people want Although “wants” are unlimited, the four major “resources” are limited… How do consumers and producers make decisions? 2-17
Scarcity, Choice and Opportunity Cost Limited Resources and Unlimited Wants Scarcity Choices Opportunity Cost 2-18
What resources are used to obtain these things? Land Land is often called the natural resource and consists of all the gifts of nature. It is a scarce resource because there is only a limited amount of land available. 2-20
Labor (a.k.a. human capital) Labor is the human resource that includes all productive contributions made by individuals who work involving both mental and physical activities. It is a scarce resource because there is only a limited amount of people available to work. What resources are used to obtain these things? What resources are used to obtain these things? 2-21
Capital Capital is all manufactured resources that are used for production (i.e. equipment, machinery, factories). In economics, money is NOT considered capital—it doesn’t produce anything! It is a scarce resource because there are a limited number of machines, equipment and factories. What resources are used to obtain these things? What resources are used to obtain these things? 2-22
Entrepreneurship An entrepreneur is an individual who is willing to take a risk to start a business. It is a scarce resource because there is a limited amount of individuals who want to start his or her own business. What resources are used to obtain these things? What resources are used to obtain these things? 2-23
Scarcity Scarcity occurs when the ingredients (resources) for producing things that people desire are insufficient to satisfy all wants. “Mathematical” Definition of Economics Economics = Scarcity = Wants > Resources 2-24
The Economic Person:Rational Self-Interest • Economists assume that individuals act as if motivated by self-interest and respond predictably to opportunities for gain. • Rationality Assumption • The assumption that people do not intentionally make decisions that would leave them worse off 25
The Economic Person:Rational Self-Interest “It is not from the benevolence of the butcher, the brewer, or the baker that we expect our dinner, but from their regard to their own interest.” —Adam Smith, An Inquiry into the Nature and Causes of the Wealth of Nations, 1776 26
The Economic Person:Rational Self-Interest • Question • Does the fact that some people make apparently irrational choices invalidate the rationality assumption in economics? 27
The Economic Person:Rational Self-Interest • Defining self-interest • The pursuit of one’s goals, does not always mean increasing one’s wealth • Prestige (conspicuous consumption) • Friendship • Love 28
Positive vs. Normative Economics • Positive Economics (most economics focus on this) • Purely descriptive statements or scientific predictions; “If A, then B,” a statement of what is (objective policy analysis) • Normative Economics (political slant) • Analysis involving value judgments; relates to whether things are good or bad, a statement of what ought to be (subjective beliefs of policymakers) • Red Flags: good/bad, desirable/undesirable, better/worse 29
http://www.investopedia.com/video/play/positive-and-normative-economics/http://www.investopedia.com/video/play/positive-and-normative-economics/
When and Why Economists Disagree • When? • Why? • Models • Values • Eventually resolved by research and data, though that has limitations… 31
Do Now. • Define: • Recession • Expansion
Module 2: Introduction to Macroeconomics 33
Microeconomics vs. Macroeconomics • Microeconomics • The study of decision making undertaken by individuals (or households) and by firms • Like looking though a microscope to focus on the smaller parts of the economy • Macroeconomics • The study of the behavior of the economy as whole • Deals with economy-wide phenomena 34
GDP tends to grow at about 1-2% per year. This does not mean that at every point in time the GDP is increasing at 1-2%. The ups and downs in business activity throughout the economy are called the business cycle. The Business Cycle
High Employment (Low Unemployment) Stable Prices (Low Inflation/Deflation) Economic Growth The 3 Goals of the Macroeconomy
Unemployment The percentage of the measured labor force that is unemployed. Total number of adults (aged 16 years or older) willing and able to work and who are actively looking for work and have not found a job Remains the most closely watched and highly publicized labor statistic Increases in times of recession Decreases in times of expansion 7-39
The U.S. Unemployment Rate and the Timing of Business Cycles, 1989-2009
Prices Inflation The situation in which the average of all prices of goods and services in an economy is rising. Deflation The situation in which the average of all prices of goods and services in an economy is falling.
Economic Growth? Increase in per capita real GDP measured by its rate of change per year
Economics USAhttp://www.learner.org/vod/vod_window.html?pid=2466
Do Now. • http://www.nytimes.com/interactive/2011/09/08/us/sept-11-reckoning/cost-graphic.html?_r=0 • Identify something that you did not know before reading this article • Identify an interesting fact • Write down one question about the article
Module 3: The Production Possibilities Curve Model 45
The Use of Models in Economics • Simplified representations of the real world used as the basis for predictions or explanations. • A good economic model can be a tremendous aid to understanding… 46
Helps economists think about the trade-offs every economy faces. Helps us understand 3 aspects of the economy: Efficiency Opportunity cost Economic growth Our First Model: Production Possibilities Curve (PPC) Our First Model:The Production Possibilities Curve 2-47
Production Possibilities Curve (PPC) Represents all possible combinations of two goods or services that can be produced within a stated time period. Assumes a fixed amount of resources. Assumes that all resources are being used in the most efficient manner possible A movement from one point to another on the PPC shows that some of one good must be given up to have more of another (See Figure 3-1). 2-48
Production Possibilities Curve (PPC) Our First Model:The Production Possibilities Curve 2-49
The PPC does not in practice have constant trade-offs of one good for another and is typically a curve that is bowed outward. Production Possibilities Curve (PPC) Production Possibilities Curve (PPC) • As society attempts to produce more of a good, the opportunity cost of additional units of that good generally increases. 2-50