Comparing Two Populations
This chapter discusses methods for comparing two populations to evaluate hypotheses, using the example of aspirin's effect on heart attack risk. It details the process of comparing success rates from two independent random samples, calculations for observed differences, and confidence intervals. The analysis finds a significant difference in heart attack rates between aspirin users and non-users, demonstrating aspirin's effectiveness. By applying these statistical principles, researchers can derive meaningful conclusions regarding population comparisons in various contexts.


Comparing Two Populations
E N D
Presentation Transcript
Comparing Two Populations Chapter 9 Gonick Anthony Timpson Geog 3000 Feb 21st, 2010
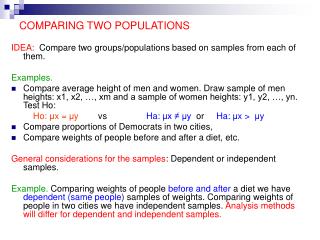
What are we doing? • How do we test questions like: • Does taking aspirin reduce the risk of heart attack • Does this pesticide increase our crop yield • Do men and women make the same wage for the same job • To test these questions we compare two independent random samples taken from each population
Comparing Success rates • In the example of Aspirin and heart attack rate • A large sample (20,000 subjects) • Two groups, placebo and aspirin • Compare directly the rates of heart attack in both groups • P-hat1 = x1/n1 and P-hat2 = x2/n2 • Where x = the number of successes in each trial n = the total sample size P-hat = rate of heart attack in sample group
Comparing Success rates • The observed difference between the two is .0217-.0126= .0091 • The observed difference in risk is • .0217/.0126 = 1.72, meaning those who do not take aspirin are 1.72 times more likely to have a heart attack
Sampling Distribution for P-hat1 - P-hat2 • For large samples P-hat1 - P-hat2 is ~ normally distributed • Remember these equations we will use the results to calculate confidence intervals on the next page • Z= ((P-hat1 - P-hat2) – (p1-p2))/σ (P-hat1 - P-hat2) • σ(P-hat1 - P-hat2) = Sqrt(σ2(P-hat1 ) + σ2(P-hat2 ))
Confidence Intervals for p1-p2 • Standard Error • SE(P-hat1 - P-hat2)= Sqrt(((P-hat1)(1- P-hat1)/n1) + (P-hat2)(1- P-hat2)/n2)) • For the aspirin test the value SE = .0175 • Confidence Interval • The range of values we can expect to see with an expected confidence level, (95% for this test) • use the difference between placebo and aspirin .0091,the z value 1.96 (95% confidence) and the SE .0175 to calculate the expected range in heart attack reduction • Expected rate of heart attack reduction with daily aspirin intake, = (.0091 +- (1.96)(.0175)) * 100%
Hypothesis Testing • Ho= 0Null Hypothesis, aspirin has no effect • Ha not = 0 Test hypothesis, aspirin has an effect • Where Z = Std dev from Ho = P-hat1 - P-hat2/ SE(P-hat1 - P-hat2)= .0091/.00175 = 5.20 • Ho = 0 • Ha = 5.20 • Aspirin definitely has an effect on heart attack rates
Summary • This is one example of comparisons between two populations • There are countless other examples, each work in the same way utilizing the same principles to achieve the same goal • The end product is a range of values which can be expected given a selected confidence level and sufficient sample size