Download
1 / 55
560 likes | 786 Vues
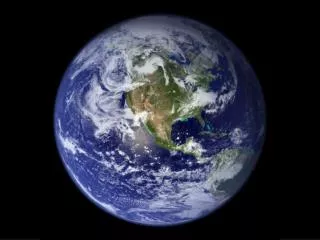
Water. 8 th Grade Science Quick Review Mr. Turnbull Mint Hill Middle School . 1. Draw a pie chart that represents the distribution of water on earth. 2. Why is stewardship of our fresh water vital? Write as many reasons as possible. 1. 97% salt 3% fresh

E N D
Water 8th Grade Science Quick Review Mr. Turnbull Mint Hill Middle School
1. Draw a pie chart that represents the distribution of water on earth. 2. Why is stewardship of our fresh water vital? Write as many reasons as possible
1. 97% salt 3% fresh Majority of fresh water in ice caps & glaciers Majority of accessible fresh water found in aquifers 2. Limited supply of fresh water Fresh water is not distributed equally on the planet or in the US Water systems are connected, Contaminated water in one area will end up in another Toxins in fresh water & salt water can accumulate in food & wild life
Describe how water moves in and out of an aquifer. How do human activities and climate conditions affect an aquifer?
3. Water moves in through recharge zone into aquifer Water out through wells Gravity moves water through the aquifer toward oceans or other major water source • Increasing the withdrawal of water from an aquifer by homes and industry lowers the water table. Without recharge (rain), water supply is depleted. Extreme drought diminishes recharge and lowers water table Pollution that enters recharge zones (animal waste/farms, landfills, illegal dumping) makes its way to groundwater
Aquifers are large reservoirs of ground water. These can be accessed by wells, some natural springs bring water out of aquifers through the force of gravity. Water in an aquifer is usually cleaner than surface water, b/c it filters through rocks and sand (recharge area) on it’s way to the aquifer. The water table is the top of the water in an aquifer.
Describe how water moves across earth’s surface. Sketching a watershed may help in your description.
A watershed is the large area of land the drains waters into streams, that then feed into larger and larger rivers, until draining into a major river. Watersheds are bordered by divides…high areas of land (mtns) that separate one watershed from another http://www.youtube.com/watch?v=2KCBRPEs4g4
Summary 97% of earth’s water is in the oceans Of the remaining 3% fresh water…most is frozen in glaciers and polar ice caps The largest % of fresh water is groundwater… aquifers Fresh water moves across earth’s surface in watersheds/riverbasins
Water Quality Indicators The health of a water system is determined by the balance between physical, chemical, and biological variables. Physical variables include temperature, turbidity. Chemical variables include dissolved oxygen and other gases, pH, nitrates and phosphates. Both natural and man-made forces are constantly changing these variables. Biological variables are living organisms.
Describe:a) How each of the following indicators affects water quality. b) What may cause each to reach an unhealthy level? Temperature Turbidity Dissolved Oxygen pH Nitrates and Phosphates
Water Quality Indicator NotesTurbidity Description: Murkiness of water due to suspended particles Levels: Ideal = 1NTU High = 5 NTU+
Turbidity Causes: Erosion from construction urban run off disturbance of stream beds from bottom feeders/livestock increased algal growth septic system leaks decaying plant matter flooding
Turbidity Results: Increase temperature Decrease in DO Clogs gills in some aquatic organisms, smothers aquatic plants making photosynthesis difficult
Temperature Definition: Amount of kinetic energy Levels: Low: cannot be tolerated below 320F High: only rough fish can tolerate temperatures above 970F
Temperature Causes: Loss of shade from removal of vegetation Thermal Pollution: industry discharge seasonal temp changes Results: Decreased levels of DO increased bacterial levels increased algae growth
4. Thermal pollution from human activities Temperature increases from human activities Photo: Dominion Virginia Power – North Anna Power Station
pH Description: • How acidic is the water Levels: 07 is acidic 7 is neutral 714 is basic • Surface Freshwater: 6.0 9.0
pH Cause: • Acid rain • minerals in soils Results: • Death of sensitive bio-indicators • Death or damage to plants
What is pH? 0-7 water is acidic 7 water is neutral 7-14 water is basic
What is the optimum freshwater pH? Rainfall: 5 – 6.5 Most freshwater systems: 7 - 8 Most aquatic organisms: 6.5 – 8.2
Dissolved Oxygen Description: Oxygen gas dissolved in water O2 enters water through photosynthesis and churning water Levels: 4-5 ppm optimal to support life
Dissolved Oxygen Cause: • Increased Temp • Decaying plant material Effect: • Less diversity of bio-indicators • fish-kills
Nitrates & Phosphates Description: • Excess nutrients Level: • Nitrates above 1 ppm • Phosphates above .003 ppm
Nitrates & Phosphates Cause: Fertilizer run off Animal waste Leaking septic systems Manure pits (hog farms, etc) Clay soils (phosphates) Result: Eutrophication – overgrowth of algae (pond scum) Low DO
What are bio-indicators and how are they used to determine water quality?
Bio-Indicators Description: • Macro-invertebrates living in water that are sensitive to pollution Healthy Level: • Large numbers and diversity
Bio-indicators are living organisms that require specific conditions in order to survive. Their presence in waters, or lack of presence, is an indicator of the health of a water system. They can be used as sentinels of a developing problem
What is eutrophication? Describe the impact of human activity on eutrophication.
Bio-Indicators Cause: • Increased levels of pollution Result: • Less diversity of organisms • Fewer organisms
EUTROPHICATION FLOW CHARTExcess Nutrients Algal Bloom (pond scum) darkness below surface photosynthesis stops decomposers & other organisms use up oxygen DEATH (gradual buildup of dying plant matter the pond becomes a meadow)
Identify each of the following as point source or nonpoint source pollution: 2. 3. 4. 5. 6. Runoff
Stewardship implies that we are caretakers of our water for future generations. The EPA established the Clean Water Act to ensure oversight and testing of surface waters
Label the following ocean regionsWhat variables are used to create these regions?
Label the following ocean regionsWhat variables are used to create these regions? Ocean regions are determined by temperature and light penetration Intertidal Neritic Open ocean Deep ocean
1. Intertidal • Shallowest area • Between the low and high tide lines • Changing environment
2. Neritic Zone • Always underwater • On continental shelf • Coral reef…diversity & nutrients
Plankton Phytoplankton =ocean producers Zooplankton eat phytoplankton
Sponge with brittle star Coral
Oceanic Zones Open Ocean • Surface – 200 meters • Sunlight, warm • Less plentiful nutrients
Brittle Stars Deep Zone - starts at continental slope and extends to 4000 m - little or no sunlight - cold 4°C - very high pressure
Ogrefish Deep Sea Angler Coelacanth
How does water move through the ocean? • Water moves through the ocean, driven by currents. Surface currents are caused by waves, deep currents are caused by differences in density.
Nutrients move up from the ocean floor through upwelling. • http://www.youtube.com/watch?v=APMzM-xYlOs How do climate patterns affect upwelling?