Download
1 / 15
150 likes | 265 Vues
Circuit City Stores, Inc. Jonathan Murphy ACG2021 SECTION 004. Executive Summary.

E N D
Circuit City Stores, Inc.Jonathan Murphy ACG2021 SECTION 004
Executive Summary I believe that Circuit City has a great future. Sales of digital televisions is expected to grow 33 percent in the next year. This is mainly due to flat-panel technologies and lower prices on rear-projection televisions. Circuit City leaders are planning to make vast improvements in order to receive better returns to their shareholders. For instance, cost and expense reductions are definitely needed to achieve reasonable profitability along with maximizing their gross profit margin. I believe the expansion of the company on the world wide web and the decrease in prices is going to help against competitors. Overall, Circuit City is doing well as long as they can continue to increase their total sales. http://www.irin.com/ (Annual Report Resource Center)
Introduction • Chief executive officer: W. Alan McCollough • Home office:9950 Maryland Drive Richmond, VA 23233-1464 • Ending date of latest fiscal year: Feb. 29, 2004 • Products: Electronics (computers, home audio & video, car audio, digital audio, video, and recording) and electronic accessories. • Circuit City has locations all over the United States.
Audit Report Independent Auditors • Ronald M. Brill • Carolyn H. Byrd • Richard N. Cooper • Barbara S. Feigin • Allen B. King • Mikael Salovaara • The consolidated financial statements seem to fairly represent the financial position of Circuit City Stores, Inc. and subsidiaries as of Feb. 29, 2004. The results of their operations and cash flows follow the generally accepted accounting principles.
Stock Market Information • Company’s most recent stock price: $16.25 • 52wk Range: 8.69 – 16.36 • Dividend per share: $.0175 • Company stock price as of Feb. 29, 2004 • I would probably hold or sell stock because the price is at a high for the year and still seems to be increasing.
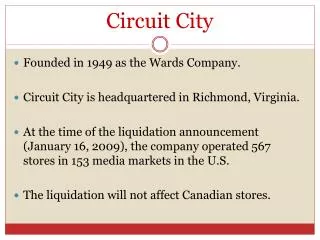
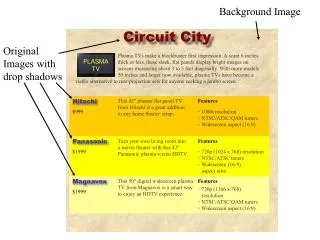
Industry Situation and Company Plans Overall, the industry seems to be in pretty good shape. Major accomplishments in this past year include: Superstore openings, sale of the finance operations, an increase in sales originating from circuitcity.com, and focusing on cost and expense reductions. Future plans of the company are to build stores that can support an industry-leading shopping experience and to work towards improving operating margins.
Income Statement The Income Statement has appears to have a multi-step format. PERIOD ENDING 31-Aug-04 31-May-04 29-Feb-04 30-Nov-03 Total Revenue 2,345,026 2,066,588 3,249,001 2,407,424 Cost of Revenue 1,767,491 1,586,153 2,492,185 1,872,600 Gross Profit5 77,535 480,435 756,816 534,824 Selling General and Administrative 594,620 493,899 636,792 578,867 Operating Income or Loss (17,085) (13,464) 120,024 (44,043) Income from Continuing OperationsTotal - 5,564 10,275 177,833 Earnings Before Interest And Taxes (17,085) (7,900) 130,299 133,790 Interest Expense 799 350 325 169 Income Before Tax (17,884) (8,250) 129,974 133,621 Income Tax Expense (6,468) (3,016) 47,440 48,773 Net Income From Continuing Ops (11,416) (5,234) 82,534 84,848 Non-recurring EventsDiscontinued Operations (507) (707) (5,107) (83,375) Net Income (11,923) (5,941) 77,427 1,473 Net Income Applicable To Common Shares ($11,923) ($5,941) $77,427 $1,473 There has been a considerable decrease in profit causing an overall decrease in net income.
Balance Sheet At February 29 or 28 (Amounts in thousands except share data) 2004 2003 ASSETS CURRENT ASSETS: Cash and cash equivalents [NOTE 2]....................................................................$ 783,471 $ 884,670 Accounts receivable, net of allowance for doubtful accounts of $547 and $1,075..154,039 140,385 Retained interests in securitized receivables [NOTES 2 AND 6]............................425,678 239,141 Merchandise inventory [NOTE 2] ....................................................................................................................................1,517,256 1,409,736 Prepaid expenses and other current assets......................................................................38,617 18,165 Assets of discontinued operations [NOTE 3]...................................................................— 395,813 TOTAL CURRENT ASSETS .................................................................................2,919,061 3,087,910 Property and equipment, net [NOTES 2, 8 AND 9]......................................................585,903 649,593 Deferred income taxes [NOTES 2 AND 10]...................................................................98,934 64,509 Other assets [NOTE 15] ..................................................................................................29,102 39,252 TOTAL ASSETS .....................................................................................................$3,633,000 $3,841,264 Liabilities of discontinued operations shows a significant decrease. Retained interests in receivables and deferred income tax accounts show the largest increase.
LIABILITIES AND STOCKHOLDERS’ EQUITY • CURRENT LIABILITIES: • Accounts payable [NOTE 2] ...............................................................................................................$ 879,635 $ 963,701 • Accrued expenses and other current liabilities [NOTES 3 AND 15] .....................................................131,512 113,878 • Accrued income taxes...............................................................................................................................71,163 44,453 • Deferred income taxes [NOTES 2 AND 10].............................................................................................90,210 1,403 • Current installments of long-term debt [NOTES 9 AND 11]................................................................... ..1,115 1,410 • Liabilities of discontinued operations [NOTE 3].................................................................................. …..3,068 60,180 • TOTAL CURRENT LIABILITIES ..................................................................................................1,176,703 1,275,025 • Long-term debt, excluding current installments [NOTES 9 AND 11]...................................................... 22,691 11,254 • Accrued straight-line rent [NOTE 2]......................................................................................................... 98,470 97,427 • Other liabilities [NOTE 11].................................................................................................................. …111,175 83,690 • TOTAL LIABILITIES ....................................................................................................................... 1,409,039 1,467,396 • STOCKHOLDERS’ EQUITY [NOTES 1, 2, 13 AND 14]: • Common stock, $0.50 par value; 525,000,000 shares authorized; • 203,899,395 shares issued and outstanding (209,954,840 in 2003) ................................................ ……101,950 104,977 • Capital in excess of par value ........................................................................................................... …...922,600 965,551 • Retained earnings............................................................................................................................ …...1,199,411 1,303,340 • TOTAL STOCKHOLDERS’ EQUITY ............................................................................................. 2,223,961 2,373,868 • Commitments and contingent liabilities [NOTES 3, 11, 12 AND 15] • TOTAL LIABILITIES AND STOCKHOLDERS’ EQUITY .........................................................$3,633,000 $3,841,264
Statement of Cash Flows Cash flows from operations are less than net income for the past two years. In fiscal 2005, Circuit City expects to open 60 to 70 superstores, with a relatively even split between new stores and relocations. Common stock is Circuit City’s primary source of financing. Cash has decreased over the past two years.
Accounting Policies The company recognizes revenue when the earnings process is complete, generally either at the time of sale to a customer or upon delivery. Cash and cash equivalents held by the company’s regulated subsidiaries was $61.6 million at Feb. 29, 2004. Highly liquid debt securities with original maturities of 3 months or less totaled $699.6 million at Feb. 29, 2004. Inventory is comprised of finished goods held for sale and is stated at the lower of cost or market. Cost is determined by the average cost method. Property & equipment is stated at cost less accumulated depreciation and amortization. Depreciation and amortization are calculated using the straight-line method over the asset’s estimated useful lives. Notes Basis of presentation, summary of significant accounting policies, discontinued operations, finance income, net (loss) earnings per share, securitizations, financial derivatives, property & equipment, debt, income taxes, lease commitments, contingent liabilities, capital stock, stock-based incentive plans, pension plans, recent accounting pronouncements, segment information, subsequent event, quarterly financial data (unaudited).
Financial AnalysisLiquidity Ratios • Working Capital: $1,742,358 (’04) –Current assets exceed current liabilities. • Current Ratio: 2.48 (‘04) –Circuit City has $2.48 of current assets for each $1.00 of current liabilities. • Receivable turnover: 66.2 (’04) –May have longer credit terms. • Average days’ sales uncollected: 5.5 days -Circuit City turns its receivables 66.2 times a year, for an average of every 5.5 days. • Inventory turnover: 5.1 times • Average days’ inventory on hand: 71.6 days –Circuit City turned its inventory over 5.1 times in 2004, or, on average, every 71.6 days.
Financial AnalysisProfitability Ratios • Profit margin: .007 (.7%) -On each dollar of net sales, Circuit City made.7 cents. • Asset turnover: 2.6 times –Circuit City produces $2.60 in sales for each $1 invested in average total assets. • Return on assets: .024 (2.4%) –For each dollar invested, Circuit City’s assets generated 2.4 cents of net income. • Return on equity: .034 (3.4%) –In 2004 Circuit City earned 3.4 cents for every dollar invested by stockholders.
Financial AnalysisSolvency Ratio • Debt to equity: .634 (63.4%) -A debt to equity ratio of 63.4% means that Circuit City receives less than half its financing from creditors and more than half from its investors.
Financial AnalysisMarket Strength Ratios • Price/earnings per share: .236 • Dividend yield: .07 (0.43%) cc