Download
1 / 20
200 likes | 356 Vues
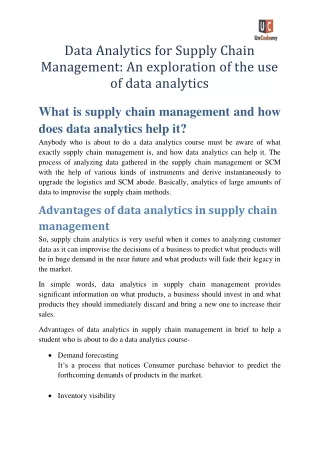
Supply Chain Spend Analytics. Web Based Business Analytics Portal. Objectives of Spend Analytics Portal. Business Objective is to increase profitability and ROI of the supply chain and procurement operations by providing deep and actionable insights into Vendor | Item | Rate | Volume

E N D
Supply Chain Spend Analytics Web Based Business Analytics Portal
Objectives of Spend Analytics Portal • Business Objective is to increase profitability and ROI of the supply chain and procurement operations by providing deep and actionable insights into Vendor | Item | Rate | Volume • Spend Inflation Analysis • Spend Inflation Control Tower • 3rd Party Funding Analysis
Definitions • Review Period: The month(s) that will be analyzed • Baseline Period: The month(s) with which the Review Period will be compared for price inflation; For inflation analysis, Baseline Period needs to be of the same duration as Review Period • Spend Inflation: • Any increase in Unit Rate in a month of the Review Period for an item-supplier compared to any month in the Baseline Period • Any new supplier-item combination in a month of the Review Period compared to any month in the Baseline Period • Any increase in total volume for a supplier-item combination in the Review Period compared to the Baseline Period • Red Alert By Category: An inflation will be flagged as Red Alert if: • The Unit Rate inflation equals or exceeds the % increase setup in the Red Alert configuration window • Spend due to increased volume equals or exceeds the % increase setup in the Red Alert configuration window
Spend Inflation Analysis • The portal provides deep dive views into the supply chain spend data, in order to provide management actionable insights into - • Total Spend Inflation • Unit Rate Inflation • New Item / Supplier Inflation • Increased Volume Inflation
Total Spend Inflation Reviews: Total Inflation | Total Inflations from Item, Supplier, Volume Sign out You have logged in as John Doe Review Period: Jan – Dec 2018 Baseline Period: Jan – Dec 2017 Click # of Suppliers Control Tower Control Tower Control Tower
Unit Rate Inflation Sign out You have logged in as John Doe Spend Inflation Analytics Unit Rate Increase # of Suppliers Spend Due To rate Change Click Review Period: Jan-18 – Dec -18 Baseline Period: Jan-17 – Dec -17
New Item or Supplier Inflation Sign out You have logged in as John Doe Spend Inflation Analytics New Item/ Supplier Jan 2018 TOTAL: $3,497 • Note: • Default Sorting: Invoice Line # (1 to n) • All columns are sort-able
Spend Inflation Control Tower • The Portal has a Control Tower feature • Control Tower brings out the individual occurrences of spend inflation • User can come to the Control Tower directly from the Home page or by drilling down from Spend Inflation Analytics • Control Tower will be typically used to view and act on spend inflation items that are Unaddressed or WIP (Default). However, the user can choose to see Addressed inflation items as well. • All inflation items are unaddressed to start with. User can act to make them WIP or Addressed.
Control Tower – Unit Rate Increase You have logged in as John Doe Sign out Control Tower – Items Not Yet Addressed Click Unit Rate Increase Review Period: Jan-18 – Dec -18 Baseline Period: Jan-17 – Dec -17 Advanced text Search Text ACT ACT ACT ACT ACT ACT ACT ACT ACT ACT ACT ACT ACT ACT
Control Tower – New Item or Supplier You have logged in as John Doe Sign out Control Tower – Items Not Yet Addressed Click New Item/ Suppliers Review Period: Jan-18 – Dec -18 Baseline Period: Jan-17 – Dec -17 ACT ACT ACT TOTAL: $103, 342 • Note: • Default Sorting: Invoice Line #(1 to n) • All columns are sort-able
Control Tower – Volume Inflation Control Tower – Items Not Yet Addressed You have logged in as John Doe Sign out Increased Volume Click on row Text Advanced text Search ACT ACT ACT ACT • Note: • Default Sorting: Invoice Amount (high to low) • All columns are sort-able
Control Tower – Volume Inflation Detail You have logged in as John Doe Sign out Control Tower – Items Not Yet Addressed Mandatory if status changed to Approved Increased Volume Spend Inflation Analytics System Updated Cancel Save
Control Tower – Other Features • Auto Generated Email • Auto Email Generation Trigger Points: • When Admin creates new user (User or Super User) • Control Tower Summary Report • When Task is Assigned by Super User • Control Tower Summary Report Daily/ Weekly/ Monthly Summary Data*
3rd Party Funding Analysis • Suppliers use bill discounting by approved 3rd party financiers - to increase profitability by optimizing discounting / Working Capital cycle - portal provides insights into • Quantum of 3rd Party Funding • Search by Supplier Name & ID & Category ID • Obtains detailed drill down up to invoice row item level, including approval status.
3rd Party Funding Analysis – Screen Flow 1 Sign out You have logged in as John Doe 4 3rd Party Funding Analysis Click 3rd Party Funding # of Suppliers
3rd Party Funding Analysis – Screen Flow 1.1 Sign out You have logged in as John Doe 3rd Party Funding Analysis 4.1 Text Advanced text Search Jan 2018 Click • Note: • Default Sorting: Invoice Amount (high to low) • All columns are sort-able
3rd Party Funding Analysis – Screen Flow 1.2 Sign out You have logged in as John Doe 3rd Party Funding Analysis 4.2 Click Jan 2018 • Note: • Default Sorting: Invoice Date (recent to older) • All columns are sort-able
3rd Party Funding Analysis – Screen Flow 1.3 Sign out You have logged in as John Doe 3rd Party Funding Analysis 4.3 Jan 2018 TOTAL: $3,497 • Note: • Default Sorting: Invoice Line # (1 to n) • All columns are sort-able


![Supply Chain Analytics Market Share & Growth [2030]](https://cdn7.slideserve.com/12353951/supply-chain-analytics-market-to-reflect-dt.jpg)