
Clinical Impact of 2D vs. 3D Gamma Analysis in Radiology Quality Assurance
Explore the impact of switching to 3D gamma for quality assurance in radiology using comparable clinical action limits. Results show enhanced gamma agreement in 3D than 2D analysis across acceptance criteria. Discover potential dosimetric error detection with 3D analysis.

Clinical Impact of 2D vs. 3D Gamma Analysis in Radiology Quality Assurance
E N D
Presentation Transcript
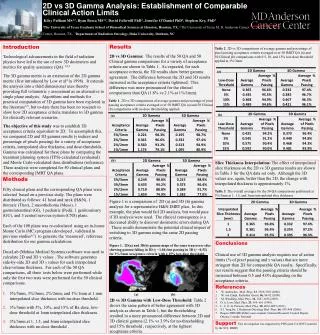
2D vs 3D Gamma Analysis: Establishment of Comparable Clinical Action LimitsKileyPulliam MS1,2, Ryan Bosca MS1,2, David FollowillPhD2, Jennifer O’Daniel PhD3, Stephen Kry, PhD2 1The University of Texas Graduate School of Biomedical Sciences at Houston, Houston, TX, 2 The University of Texas M. D. Anderson Cancer Center, Houston, TX, 3Department of Radiation Oncology, Duke University, Durham, NC Results 2D vs 3D Gamma: The results of the 50 QA and 50 Clinical gamma comparisons for a variety of acceptance criteria are shown in Table 1. As expected, for each acceptance criteria, the 3D results show better gamma agreement. The difference between the 2D and 3D results increased as the acceptance criteria tightened. This difference was more pronounced for the clinical comparisons than QA (1.8% vs 2.1% at 1%/1mm). Figure 1 is a comparison of 2D (a) and 3D (b) gamma analysis for a representative H&N IMRT plan. In this example, the plan would fail 2D analysis, but would pass if 3D analysis were used. The clinical consequence is a decreased ability to discover dosimetric errors during QA . These results demonstrate the potential clinical impact of switching to 3D gamma using the same 2D passing criteria. . Introduction Technological advancements in the field of radiation physics have led to the use of new 3D dosimeters and metrics for quality assurance (QA) 1,2,3 The 3D gamma metric is an extension of the 2D gamma metric (first introduced by Low et al4 in 1998). It extends the analysis into a third dimensional axes thereby providing full volumetric γ assessment as an alternative to single plane analysis. Algorithms and methods for practical computation of 3D gamma have been explored in the literature3,5, but to-date there has been no research to show how 2D acceptance criteria translates to 3D gamma for clinically relevant scenarios. The objective of this study was to establish 3D acceptance criteria equivalent to 2D. To accomplish this, we compared 2D and 3D gamma results (γ indices and percentage of pixels passing) for a variety of acceptance criteria, interpolated slice thickness, and dose-thresholds. Gamma was calculated for these plans by comparing the treatment planning system (TPS)-calculated (evaluated) and Monte Carlo-calculated dose distributions (reference). These analysis were completed for 50 clinical plans and the corresponding IMRT QA plans. Table 2. 2D vs 3D comparisons of average gamma and percentage of pixel passing acceptance criteria averaged over 50 IMRT QA (a) and 50 Clinical (b) comparisons with 0 5, 10, and 15% low-dose threshold applied at 3%/3mm. (a) Table 1. 2D vs 3D comparisons of average gamma and percentage of pixel passing acceptance criteria averaged over 50 IMRT QA (a) and 50 Clinical (b) comparisons with no dose thresholding applied. (b) (a) Figure 1. 2D(a) and 3D(b) gamma maps of the same transverse slice showing gamma failing in 2D (γ =1.04) but passing in 3D (γ =0.52) for 3%/3mm acceptance criteria with a 15% low-dose threshold. (a) (b) (b) Slice Thickness Interpolation: The effect of interpolated slice thickness on the 2D vs 3D gamma results are shown in Table 3 for the QA data set only. Although the 3D values are, again, better than the 2D, the change with interpolated thickness is approximately 1%. Methods Fifty clinical plans and the corresponding QA plans were selected based on a previous study.The plans were distributed as follows: 41 head and neck (H&N), 1 thoracic (Thor), 2 mesothelioma (Meso), 1 gastrointenstinal (GI), 1 pediatric (Pedi), 1 genitourinary (GU), and 3 central nervous system (CNS) plans. Each of the 100 plans was re-calculated using an in-house Monte Carlo (MC) program (developed , validated in previous studies6,7) to generate the ‘measured’, reference distribution for our gamma calculations. DoseLab (Mobius Medical Systems) software was used to calculate 2D and 3D γ values . The software generates side-by-side 2D and 3D γ values for each interpolated slice/volume thickness. For each of the 50 QA comparisons, all three tests below were performed while only the first two tests were performed for the 50 clinical comparisons. 5%/5mm, 3%/3mm, 2%/2mm, and 1%/1mm at 1 mm interpolated slice thickness with no-dose threshold. 3%/3mm with 5%, 10%, and 15% of Rx dose, low-dose threshold at 1mm interpolated slice thickness. 3%/3mm at 1, 1.5, and 3mm interpolated slice thickness with no-dose threshold . Table 3. The overall averages for the 50 QA comparisons performed at 3%/3mm at 1, 1.5, and 3mm interpolated slice thickness Conclusions Clinical use of 3D gamma analysis requires use of action limits (% of pixel passing and γ values) that are more stringent than 2D for comparable QA results. Specifically, our results suggest that the passing criteria should be increased between 0.5 and 4.0% depending on the acceptance criteria. References W. Ansbacher,. Med. Phys. 33, 3369-3382 (2006). W. van Elmpt, RadiotherOncol, 86, 86-92 (2008). M. Wendling, Med. Phys. 34, 1647-1654 (2007). D. A. Low, Med. Phys. 25, 656–661 (1998). L. C. G. G. Persoon, Med. Phys. 38, 4032-4035 (2011). S.I. Yang,Int. J. Radiation Oncology Biol. Phys. 66, 939-948 (2006). Rogers DWO,BEAMnrc users manual. National Research Council Report. Ottawa, Canada: National 2D vs 3D Gamma with Low-Dose Threshold: Table 2 shows the same pattern of better agreement with 3D analysis as shown in Table 1, but the thresholding resulted in a more pronounced difference between 2D and 3D clinical gamma (2.1% vs 3.9% for no-thresholding and 15% threshold , respectively, at the tightest acceptance criteria. Support This investigation was supported by PHS grant CA10953 awarded by the NCI, DHHS


