Download
1 / 17
170 likes | 187 Vues
Get all insights, past performances, historical NAVs and dividend history for Franklin India Smaller Companies Funds. Also, know why you should invest in Franklin India Smaller Companies Fund here.<br>Invest now In Franklin India Smaller Companies Fund here: https://www.franklintempletonindia.com/investor/fund-details/fund-overview/franklin-india-smaller-companies-fund-4373<br>

E N D
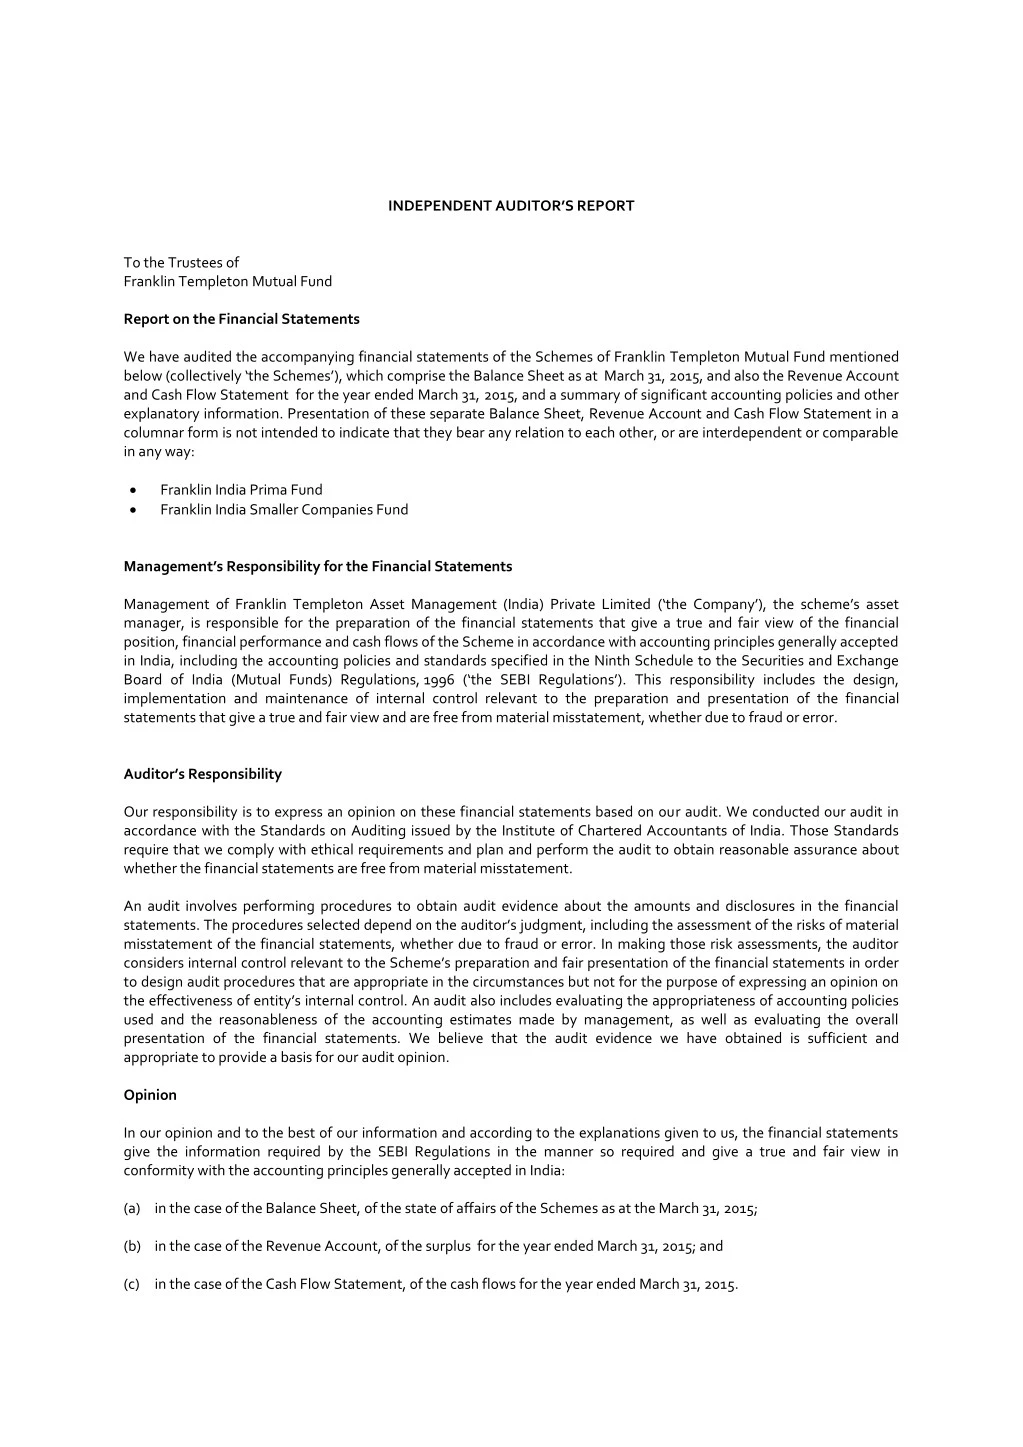
INDEPENDENT AUDITOR’S REPORT To the Trustees of Franklin Templeton Mutual Fund Report on the Financial Statements We have audited the accompanying financial statements of the Schemes of Franklin Templeton Mutual Fund mentioned below (collectively ‘the Schemes’), which comprise the Balance Sheet as at March 31, 2015, and also the Revenue Account and Cash Flow Statement for the year ended March 31, 2015, and a summary of significant accounting policies and other explanatory information. Presentation of these separate Balance Sheet, Revenue Account and Cash Flow Statement in a columnar form is not intended to indicate that they bear any relation to each other, or are interdependent or comparable in any way: Franklin India Prima Fund Franklin India Smaller Companies Fund Management’s Responsibility for the Financial Statements Management of Franklin Templeton Asset Management (India) Private Limited (‘the Company’), the scheme’s asset manager, is responsible for the preparation of the financial statements that give a true and fair view of the financial position, financial performance and cash flows of the Scheme in accordance with accounting principles generally accepted in India, including the accounting policies and standards specified in the Ninth Schedule to the Securities and Exchange Board of India (Mutual Funds) Regulations, 1996 (‘the SEBI Regulations’). This responsibility includes the design, implementation and maintenance of internal control relevant to the preparation and presentation of the financial statements that give a true and fair view and are free from material misstatement, whether due to fraud or error. Auditor’s Responsibility Our responsibility is to express an opinion on these financial statements based on our audit. We conducted our audit in accordance with the Standards on Auditing issued by the Institute of Chartered Accountants of India. Those Standards require that we comply with ethical requirements and plan and perform the audit to obtain reasonable assurance about whether the financial statements are free from material misstatement. An audit involves performing procedures to obtain audit evidence about the amounts and disclosures in the financial statements. The procedures selected depend on the auditor’s judgment, including the assessment of the risks of material misstatement of the financial statements, whether due to fraud or error. In making those risk assessments, the auditor considers internal control relevant to the Scheme’s preparation and fair presentation of the financial statements in order to design audit procedures that are appropriate in the circumstances but not for the purpose of expressing an opinion on the effectiveness of entity’s internal control. An audit also includes evaluating the appropriateness of accounting policies used and the reasonableness of the accounting estimates made by management, as well as evaluating the overall presentation of the financial statements. We believe that the audit evidence we have obtained is sufficient and appropriate to provide a basis for our audit opinion. Opinion In our opinion and to the best of our information and according to the explanations given to us, the financial statements give the information required by the SEBI Regulations in the manner so required and give a true and fair view in conformity with the accounting principles generally accepted in India: (a)in the case of the Balance Sheet, of the state of affairs of the Schemes as at the March 31, 2015; (b)in the case of the Revenue Account, of the surplus for the year ended March 31, 2015; and (c)in the case of the Cash Flow Statement, of the cash flows for the year ended March 31, 2015.
Report on Other Legal and Regulatory Requirements 1. We have obtained all the information and explanations, which to the best of our knowledge and belief were necessary for the purposes of our audit. 2. The balance sheet, revenue account and cash flow statement dealt with by this report are in agreement with the books of account. 3. In our opinion, the balance sheet and revenue account dealt with by this report have been prepared in conformity with the accounting policies and standards specified in the Ninth Schedule to the SEBI Regulations. 4. In our opinion, and on the basis of information and explanations given to us, the methods used to value non traded securities as at March 31, 2015 are in accordance with the SEBI Regulations and other guidelines issued by the Securities and Exchange Board of India, as applicable, and approved by the Board of Trustees, and are fair and reasonable. For S.R. BATLIBOI & CO. LLP Chartered Accountants ICAI Firm Registration Number: 301003E Sd/- per Shrawan Jalan Partner Membership Number: 102102 Place: Mumbai Date: July 06, 2015
FRANKLIN TEMPLETON MUTUAL FUND BALANCE SHEET AS AT MARCH 31, 2015 (All amounts in thousands of Rupees) Schedules FRANKLIN INDIA PRIMA FUND FRANKLIN INDIA SMALLER COMPANIES FUND As at As at As at As at March 31, 2015 March 31, 2014 March 31, 2015 March 31, 2014 SOURCES OF FUNDS 1 2 Unit Capital Reserves and Surplus Unit Premium Reserve Unrealised Appreciation Reserve Retained Surplus Current Liabilities and Provisions Current Liabilities TOTAL 2(b) & 3 4 2,363,466 1,584,160 5,979,798 2,309,052 2.1 2.2 2.3 3 3.1 - - 178,928 6,038,637 8,589,718 - 11,910,756 22,526,794 2,931,534 11,174,416 1,210,874 2,743,383 5 191,184 36,992,200 322,422 16,012,532 149,178 20,936,259 53,267 6,316,576 APPLICATION OF FUNDS 2(c), 6 & 16 1 Investments Listed Securities Equity Shares Unlisted Securities Equity Shares 1.1 1.1.1 1.2 1.2.1 31,377,602 10,591,890 18,662,352 4,061,368 2 2 - - 2 Other Current Assets Cash and Bank Balances CBLO/ Reverse Repo Lending Others Accumulated Unit Discount, Net TOTAL 7 2.1 2.2 2.3 3 107,284 3,022,531 68,084 2,416,697 36,992,200 40,767 785,720 169,307 4,424,846 16,012,532 93,812 2,140,683 39,412 30,304 290,780 29,138 1,904,986 6,316,576 8 - 20,936,259 Notes to Accounts 1 to 16 The accompanying schedules are an integral part of this Balance Sheet. As per our attached report of even date For S.R. Batliboi & Co.LLP ICAI Firm Registration No.: 301003E Chartered Accountants For Franklin Templeton Trustee Services Private Limited For Franklin Templeton Asset Management (India) Private Limited Sd/- per Shrawan Jalan Partner Membership No. 102102 Sd/- Anand J. Vashi Director Sd/- Deepak Satwalekar Director Sd/- S. Jayaram Director Sd/- Harshendu Bindal President Sd/- Ajay Narayan Vice President Sd/- Vivek Kudva Director Sd/- R. Janakiraman Vice President & Portfolio Manager – Franklin Equity Sd/- Roshi Jain Vice President & Portfolio Manager – Franklin Equity Sd/- Neeraj Gaurh Assistant Vice President and Portfolio Manager – Franklin Equity Anand Radhakrishnan Chief Investment Officer - (Franklin Equity India) Mumbai
FRANKLIN TEMPLETON MUTUAL FUND REVENUE ACCOUNT FOR THE YEAR ENDED MARCH 31, 2015 (All amounts in thousands of Rupees) FRANKLIN INDIA PRIMA FUND FRANKLIN INDIA SMALLER COMPANIES FUND Schedules Year ended March 31, 2015 Year ended March 31, 2014 Year ended March 31, 2015 Year ended March 31, 2014 1 INCOME Dividend Interest Realised Gain on External Sale / Redemption of Investments, net Change in Unrealised Appreciation in the value of Investments Other Income 1.1 1.2 1.3 1.4 1.5 2(d) 232,347 172,116 1,971,740 8,979,222 20,369 11,375,794 127,932 67,617 876,041 1,521,984 4,354 2,597,928 104,656 103,747 1,018,031 4,827,763 11,589 6,065,786 49,249 26,113 404,709 725,985 2(d) & 9 2(d) 2(d) 508 1,206,564 2 EXPENSES Management Fees Service Tax on Management Fees Transfer Agents Fees and Expenses Custodian Fees Trusteeship Fees Commission to Agents Investor Education Expense Marketing and Distribution Expenses Audit Fees Other Operating Expenses 2.1 2.2 2.3 2.4 2.5 2.6 2.7 2.8 2.9 2.10 10 10 231,428 28,605 32,582 2,369 113,651 14,047 13,448 127,402 15,747 18,287 1,267 59,705 7,380 5,669 426 964 254 10 715 380 96 220,032 4,767 8,232 52,176 1,695 7,696 335 6,463 210,729 113,799 2,534 8,353 9,549 642 2,440 127 1,055 87,089 2(g) 668 354 5,834 535,232 5,470 293,593 NET INCOME AS PER REVENUE ACCOUNT 3 10,840,562 2,387,199 5,772,193 1,119,475 Transfer from Retained Surplus Add: Balance Transfer from Unrealised Appreciation Reserve Less: Balance Transfer to Unrealised Appreciation Reserve Add / (Less): Equalisation Credit/(Debit) Total Dividend Appropriation Income Distributed During the Year NET SURPLUS / (DEFICIT) FOR THE YEAR TRANSFERRED TO BALANCE SHEET 4 5 6 7 8 9 4 4 4 11,174,416 2,931,534 11,910,756 10,140,449 23,176,205 9,213,621 1,409,550 2,931,534 1,692,152 11,770,988 2,743,383 1,210,874 6,038,637 5,207,559 8,895,372 2,318,617 484,889 1,210,874 172,170 2,884,277 2(e) 9.1 10 14 4 (649,411) 22,526,794 (596,572) 11,174,416 (305,654) 8,589,718 (140,894) 2,743,383 (8+9) *Amount is less than rupee one thousand Notes to Accounts 1 to 16 The accompanying schedules are an integral part of this Revenue Account. As per our attached report of even date For S.R. Batliboi & Co.LLP ICAI Firm Registration No.: 301003E Chartered Accountants For Franklin Templeton Trustee Services Private Limited For Franklin Templeton Asset Management (India) Private Limited Sd/- per Shrawan Jalan Partner Membership No. 102102 Sd/- Anand J. Vashi Director Sd/- Deepak Satwalekar Director Sd/- S. Jayaram Director Sd/- Harshendu Bindal President Sd/- Ajay Narayan Vice President Sd/- Vivek Kudva Director Sd/- Anand Radhakrishnan Chief Investment Officer - (Franklin Equity India) Sd/- R. Janakiraman Vice President & Portfolio Manager – Franklin Equity Sd/- Roshi Jain Vice President & Portfolio Manager – Franklin Equity Sd/- Neeraj Gaurh Assistant Vice President and Portfolio Manager – Franklin Equity Mumbai
FRANKLIN TEMPLETON MUTUAL FUND CASH FLOW STATEMENT FOR THE YEAR ENDED MARCH 31, 2015 (All amounts in thousands of Rupees) FRANKLIN INDIA SMALLER COMPANIES FUND FRANKLIN INDIA PRIMA FUND March 31, 2015 March 31, 2014 March 31, 2015 March 31, 2014 A Cashflow from Operating Activities Surplus for the year before equalisation and income distribution Add / (Less) :Change in Unrealised Apreciation in value of Investments 10,840,562 (8,979,222) 2,387,199 (1,521,984) 5,772,193 (4,827,763) 1,119,475 (725,985) Add / (Less) :Amortization of premium / discount on investment cost Adjustments for:- (Increase)/Decrease in Investments at Cost (Increase)/Decrease in Other Current Assets Increase/(Decrease) in Current Liabilities Net Cash Generated from/(used in) Operations - (384) - - (11,846,572) (2,255,787) 13,311 (12,227,708) (2,037,550) (210,031) (44,228) (1,426,978) (9,712,408) (1,863,005) 23,412 (10,607,571) (571,106) (104,089) (19,977) (301,682) ( A ) B Cashflow from Financing Activities Increase/(Decrease) in Unit Capital Increase/(Decrease) in Unit Premium Adjustments for:- Increase/(Decrease) in Sundry Creditors for Units Redeemed by Investors (Increase)/Decrease in Sundry Debtors for Units Issued to Investors Dividend paid during the year Increase/(Decrease) in Unclaimed redemption Increase/(Decrease) in units pending allotment Net Cash (used in)/Generated from Financing Activities 714,345 11,925,913 220,197 1,493,994 3,639,697 7,246,480 334,495 159,704 8,796 (11,163) (359,327) 1,937 13,724 12,294,225 37,554 (6,328) (293,006) 4,647 4,280 (16,435) (227,615) 1,340 23,332 10,671,079 1,905 1,006 (173,387) 4,820 978 280 ( B ) 1,458,036 328,823 Net Increase/(Decrease) in Cash and Cash Equivalents (A+B) 66,517 31,058 63,508 27,141 Cash and Cash Equivalents as at the beginning of the Year Cash and Cash Equivalents as at the end of the Year 40,767 107,284 9,709 40,767 30,304 93,812 3,163 30,304 Components of Cash and Cash Equivalents Balances with Banks in Current Accounts* 107,284 107,284 40,767 40,767 93,812 93,812 30,304 30,304 *Includes balances in unclaimed redemption / dividend bank account held towards unclaimed redemption / dividend liabilities of the Scheme As per our attached report of even date For S.R. Batliboi & Co.LLP ICAI Firm Registration No.: 301003E Chartered Accountants For Franklin Templeton Trustee Services Private Limited For Franklin Templeton Asset Management (India) Private Limited Sd/- per Shrawan Jalan Partner Membership No. 102102 Sd/- Anand J. Vashi Director Sd/- Deepak Satwalekar Director Sd/- S. Jayaram Director Sd/- Vivek Kudva Director Sd/- Harshendu Bindal President Sd/- Ajay Narayan Vice President Sd/- Anand Radhakrishnan Chief Investment Officer - (Franklin Equity India) Sd/- R. Janakiraman Vice President & Portfolio Manager – Franklin Equity Sd/- Roshi Jain Vice President & Portfolio Manager – Franklin Equity Sd/- Neeraj Gaurh Assistant Vice President and Portfolio Manager – Franklin Equity Mumbai
FRANKLIN TEMPLETON MUTUAL FUND SCHEDULES TO THE BALANCE SHEET AND REVENUE ACCOUNT FOR THE YEAR ENDED MARCH 31, 2015 (All amounts in thousands of Rupees unless specified otherwise) 1. BACKGROUND Franklin Templeton Mutual Fund (‘the Fund’) was established as a trust under the Indian Trusts Act, 1882, by way of a trust deed dated January 4, 1996, a supplementary trust deed dated March 30, 1996 and August 26, 2005 executed by Templeton International Inc. USA, the sponsor of the Fund. Templeton International Inc. is a part of the Franklin Templeton Investments group. In accordance with the Securities and Exchange Board of India (‘SEBI’) (Mutual Funds) Regulations, 1996 (‘the SEBI Regulations’), the Board of Directors of Franklin Templeton Trustee Services Private Limited (‘the Trustee’) has appointed Franklin Templeton Asset Management (India) Private Limited ('the AMC') to manage the Fund’s affairs and operate its Schemes. The objective and other feature of the schemes covered in the financial statement are as under: Nature of the Scheme Scheme Name Scheme Objective Plans Offered Date of Allotment Franklin India Prima Fund Open Ended Mutual Fund Scheme December 1, 1993 The Scheme aims to achieve capital appreciation through investments in relatively smaller, faster growing companies. The Scheme offers its investors two plans: the Dividend Plan and the Growth Plan (‘the Plans’). Effective January 1, 2013, in accordance with SEBI Circular no. CIR/IMD/DF/21/2012 dated September 13, 2012, the Scheme introduced a new Plan under each of the Existing plan / option, termed as ‘Direct’. Franklin India Smaller Companies Fund Open Ended Mutual Fund Scheme November 16, 2005 The Scheme seeks to provide long-term capital appreciation by investing in mid and small cap companies. The Scheme offers its investors two plans: the Dividend Plan, the Growth Plan, (‘the Plans’). Effective January 1, 2013, in accordance with SEBI Circular no. CIR/IMD/DF/21/2012 dated September 13, 2012, the Scheme introduced a new Plan under each of the Existing plan / option, termed as ‘Direct’. 2. SUMMARY OF SIGNIFICANT ACCOUNTING POLICIES The financial statements are prepared on the accrual basis of accounting, under the historical cost convention, as modified for investments, which are ‘marked-to-market’. These financial statements are prepared in accordance and conformity with the accounting policies and standards specified in the Ninth Schedule to the Securities and Exchange Board of India (Mutual Funds) Regulations, 1996. The significant accounting policies, which are in accordance with the SEBI Regulations and have been approved by the Board of Directors of the AMC and the Trustee, are stated below. Presentation of these separate Balance Sheets, the Revenue Accounts and the Cash Flows in a columnar form is not intended to indicate that they bear any relation to each other, or are interdependent or comparable in any way. (a) Determination of net asset value - The net asset value of the units of the Scheme is determined separately for units issued under the Plans after including the respective unit capital and reserves and surplus, and reducing net deficit and accumulated discount, if any. - For reporting the net asset values, the daily income earned, including realised profit or loss and unrealised gain or loss in the value of investments, and expenses incurred by the Scheme, are allocated to the Plans in proportion to their respective daily net assets as at the end of the immediately preceding day.Commission expenses are not allocated to the Direct Plans/ Options. (b) Unit capital - Unit capital represents the net outstanding units at the balance sheet date, thereby reflecting all transactions relating to the year ended on that date. - Upon issue and redemption of units, the net premium or discount to the face value of units is adjusted against the unit premium reserve of the Scheme, after an appropriate portion of the issue proceeds and redemption payouts is credited or debited respectively to the equalisation account, a mandatory requirement for open ended mutual fund Schemes. (c) Investments Accounting for investment transactions - Purchase and sale of investments are recorded on the date of the transaction, at cost and sale price respectively, after considering brokerage, commission, securities transaction tax and fees payable or receivable, if any. The front end fee receivable, if any, is reduced from the cost of investment. - Effective October 1, 2012, in terms of SEBI circular no. CIR/IMD/DF/21/2012 dated September 13, 2012, brokerage and transaction costs (including all taxes) incurred for the purpose of execution of trade in excess of 0.12% in case of cash market transaction is charged to the Total Expense Ratio of the fund. - Right entitlements are recognised as investments on the ex-rights date. - Bonus entitlements are recognised as investments on the ex-bonus date. • Initial recognition Foreign currency transactions are recorded in the reporting currency, by applying to the foreign currency amount the exchange rate between the reporting currency and the foreign currency at the date of the transaction. • Conversion Foreign currency monetary items are reported using an exchange rate prevalent on the valuation date / date of the transaction. • Exchange differences Exchange differences arising on the settlement of monetary items or on reporting monetary items of the scheme at rates different from those at which they were initially recorded during the period, or reported in previous financial statements, are recognised as income or as expenses in the period in which they arise. Valuation of investments - Effective December 1, 2014, Traded Equity, Equity related Securities and Preference Shares are valued at the last quoted closing price on the National Stock Exchange of India Limited (NSE). If a security is not traded on NSE, it will be valued at the last quoted closing price on Bombay Stock Exchange (BSE) or any other stock exchange (in that order). Prior to that, Traded Equity, Equity related Securities and Preference Shares were valued at the last quoted closing price on the Bombay Stock Exchange (BSE). If a security was not traded on BSE, it was valued at the last quoted closing price on National Stock Exchange of India Limited (NSE) or any other stock exchange (in that order).The change in primary stock exchange has resulted in a increase in appreciation of Rs.15,318,833/- and Rs.20,284,707/- on the investments as on March 31, 2015 for Franklin India Prima Fund and Franklin India Smaller Companies Fund respectively. - Investments in Equity shares acquired under Qualified Institutional Placement (QIP) are valued at cost or market value, whichever is lower, till the date of listing of the security. - Thinly Traded, Non-traded and unlisted Equity are valued "in good faith" as determined, in accordance with the SEBI Regulations.
FRANKLIN TEMPLETON MUTUAL FUND SCHEDULES TO THE BALANCE SHEET AND REVENUE ACCOUNT FOR THE YEAR ENDED MARCH 31, 2015 (All amounts in thousands of Rupees unless specified otherwise) - Foreign securities are valued at the last closing price / last available traded or quoted price on the valuation day on the relevant stock exchange around the time of closure of Indian stock markets, as applicable, provided such date is not more than thirty days prior to the valuation date and are translated in to Indian rupees by applying an exchange rate prevalent on the day of valuation/balance sheet. Unrealised foreign exchange gain or loss on account of exchange rate fluctuation is credited / debited to Reserves & Surplus / Profit & Loss account respectively on the date of valuation. In respect of non traded/ thinly traded Foreign securities, the valuation is stated at fair value as determined In good faith by the AMC. - - Effective from November 5, 2013, all Debt securities (except for Zero Coupon Bonds, Government Securities and Treasury Bills), with residual maturity greater than 365 days, on the valuation date, are valued at the weighted average price obtained from CRISIL and ICRA (agency(ies) appointed/ designated for the said purpose by the Association of Mutual Funds of India {AMFI}). If price for New security purchased is not available from CRISIL and ICRA, the security will be valued at weighted average traded price available on public platform (namely FIMMDA, NSE WDM and BSE ICDM), provided there are at least two trades aggregating to Rs. 25 crores or more. Prior to November 5, 2013, all Debt securities (except for Government Securities and Treasury Bills), with residual maturity greater than 365 days, which were traded on the valuation date, were valued at the weighted average traded price available on the public platform (namely FIMMDA, NSE WDM and BSE ICDM), provided there were at least two trades aggregating to Rs. 25 crores or more. Further, if such securities were not traded on a particular valuation day, they were valued at the average benchmark yield/ matrix of spread over risk free benchmark yield obtained from CRISIL and ICRA. Effective from November 5, 2013, all Debt securities (except for Zero Coupon Bonds, Government Securities and Treasury Bills) with residual maturity greater than 60 days and less than or equal to 365 days, on the date of valuation, are valued at the weighted average price obtained from CRISIL and ICRA (agency(ies) appointed/ designated for the said purpose by AMFI). If price for New security purchased is not available from CRISIL and ICRA , the security will be valued at weighted average traded price available on public platform (namely FIMMDA, NSE WDM and BSE ICDM), provided there are at least three trades aggregating to Rs. 100 crores or more. Prior to November 5, 2013, all Debt securities (except for Government Securities and Treasury Bills), with residual maturity greater than 60 days and less than or equal to 365 days on the date of valuation, which were traded on the valuation date, were valued at the weighted average traded price available on the public platform (namely FIMMDA, NSE WDM and BSE ICDM), provided there were at least three trades aggregating to Rs. 100 crores or more. Further, if such securities were not traded on a particular valuation day they were valued at the average benchmark yield/ matrix of spread over risk free benchmark yield obtained from CRISIL and ICRA. - - Effective from July 3, 2012, all Debt securities (except for Zero Coupon Bonds, Government Securities and Treasury Bills), with residual maturity upto 60 days on the date of valuation, which are traded on the valuation date, are valued at the weighted average traded price available on the public platform (namely FIMMDA, NSE WDM and BSE ICDM), provided there are at least three trades aggregating to Rs. 100 crores or more. When such securities are not traded on a particular valuation day, they are valued on amortisation basis. The amortised price is used as long as it is within plus/ minus 0.10% of the reference price. In case the variance exceeds plus/ minus 0.10%, the reference price is considered for valuation. Reference price is the price derived from risk free benchmark yields plus/ minus spread. - The securities with call option are valued at the lower of the value as obtained by valuing the security to final maturity and valuing the security to call option. In case there are multiple call options, the lowest value obtained by valuing to the various call dates and valuing to the maturity date is taken as the value of the instrument. The securities with put option are valued at the higher of the value as obtained by valuing the security to final maturity and valuing the security to put option. In case there are multiple put options, the highest value obtained by valuing to the various put dates and valuing to the maturity date is taken as the value of the instruments. - Effective from November 5, 2013, Investment in Zero Coupon Bonds with residual maturity greater than 365 days, on the valuation date, are valued at the weighted average price obtained from CRISIL and ICRA (agency(ies) appointed/ designated for the said purpose by AMFI). Effective from March 17, 2015, if price for New security purchased is not available from CRISIL and ICRA , the security will be valued at weighted average traded yield available on public platform (namely FIMMDA, NSE WDM and BSE ICDM), provided there are at least two trades aggregating to Rs. 25 crores or more as against the earlier practice of valuing at weighted average traded price available on public platform (namely FIMMDA, NSE WDM and BSE ICDM), provided there are at least two trades aggregating to Rs. 25 crores or more. Prior to November 5, 2013, Investment in Zero Coupon Bonds with residual maturity greater than 365 days, which were traded on the valuation date, were valued at the weighted average traded price available on the public platform (namely FIMMDA, NSE WDM and BSE ICDM), provided there were at least two trades aggregating to Rs. 25 crores or more. Further, if such securities were not traded on a particular valuation day, they were valued at the average benchmark yield/ matrix of spread over risk free benchmark yield obtained from CRISIL and ICRA. - Effective from November 5, 2013, Investment in Zero Coupon Bonds with residual maturity greater than 60 days and less than or equal to 365 days on the date of valuation are valued at the weighted average price obtained from CRISIL and ICRA (agency(ies) appointed/ designated for the said purpose by AMFI). Effective from March 17, 2015, , if price for New security purchased is not available from CRISIL and ICRA , the security will be valued at weighted average traded yield available on public platform (namely FIMMDA, NSE WDM and BSE ICDM), provided there are at least three trades aggregating to Rs. 100 crores or more as against the earlier practice of valuing at weighted average traded price available on public platform (namely FIMMDA, NSE WDM and BSE ICDM), provided there are at least three trades aggregating to Rs. 100 crores or more. Prior to November 5, 2013, Zero Coupon Bonds with residual maturity greater than 60 days and less than or equal to 365 days, which were traded on the valuation date, were valued at the weighted average traded price available on the public platform (namely FIMMDA, NSE WDM and BSE ICDM), provided there were at least three trades aggregating to Rs. 100 crores or more. Further, if such securities were not traded on a particular valuation day they were valued at the average benchmark yield/ matrix of spread over risk free benchmark yield obtained from CRISIL and ICRA. - Effective from March 17, 2015, Investment in Zero Coupon Bonds with residual maturity upto 60 days on the date of valuation, which are traded on the valuation date, are valued at the weighted average traded yield available on the public platform (namely FIMMDA, NSE WDM and BSE ICDM), provided there are at least three trades aggregating to Rs. 100 crores or more as against the earlier practice of valuing at the weighted average traded price available on the public platform (namely FIMMDA, NSE WDM and BSE ICDM), provided there are at least three trades aggregating to Rs. 100 crores or more. When such securities are not traded on a particular valuation day, they are valued on amortisation basis. - The amortised price is used as long as it is within plus/ minus 0.10% of the reference price. In case the variance exceeds plus/ minus 0.10%, the reference price is considered for valuation. Reference price is the price derived from risk free benchmark yields plus/ minus spread. - Effective from October 7, 2013, Investment in Government Securities and Treasury Bills with residual maturity up to 60 days on the date of valuation, which are traded on the valuation date, are valued at the weighted average traded price available on the public platform namely CCIL provided there are at least three trades aggregating to Rs. 100 crores or more. When such securities are not traded on a particular valuation day, they are valued on amortisation basis. The amortised price is used as long as it is within plus/ minus 0.10% of the reference price. In case the variance exceeds plus/ minus 0.10%, the reference price is considered for valuation. Reference price is the price derived from risk free benchmark yield plus/ minus spread. Prior to October 7,2013 Investments in Government securities and Treasury Bills were valued based on the average of the prices provided by the CRISIL and ICRA (agency(ies) entrusted for the said purpose by Association of Mutual Funds of India {AMFI}) on the valuation date. - Investment in Government Securities and Treasury Bills with residual maturity greater than 60 days on the date of valuation are valued based on the average of the prices provided by the CRISIL and ICRA(agency(ies) entrusted for the said purpose by AMFI) . - All other investments are stated at their fair value as determined in good faith by the AMC in accordance with the SEBI Regulations and reviewed by the Trustee. - The net unrealised gain or loss in the value of investments is determined separately for each category of investments. The change in the net unrealised gain or loss, if any, between two balance sheet dates is recognised in the revenue account and thereafter net unrealised gain, if any, is transferred to unrealised appreciation reserve. The loss on investments sold/transferred during the period is charged to the revenue account. (d) Revenue recognition - Dividend income is recognised on the ex-dividend date. - Interest income is recognised on an accrual basis. - Profit or loss on sale of investments is determined on the basis of the weighted average cost method. (e) Equalisation account - The purpose of equalization account is to maintain per unit amount of a Plan’s/Option’s share of the Scheme’s undistributed income, so that continuing unit holders’ share of undistributed income remains unchanged on issue or redemption of units under that Plan/Option. - Pursuant to SEBI circular dated March 15, 2010, the Trustee/AMC has changed the method of calculating equalization per unit w.e.f. that date viz: a) When the sale price is higher than the face value of the unit, the total accumulated undistributed income till the date of the transaction is determined. Based on the number of units outstanding on the transaction date, the undistributed income associated with each unit is computed. The per unit amount so determined is credited and debited to the equalisation account on issue and redemption of each unit respectively. b) When the sale price is lower than the face value of the unit, the difference between the Net asset value and the par value is debited and credited to the equalisation account on issue and redemption of unit respectively. (f) Load charges - All loads, including Contingent and Deferred Sales Charges, charged at the time of purchase and sale of units is being utilised towards meeting distribution and marketing expenses. The utilization from the balances as at July 31, 2009 is restricted to a maximum of one third of the load balances as at that date - Effective October 1, 2012, in accordance with the SEBI Circular no. CIR/IMD/DF/21/2012 dated September 13, 2012, entire amount of Exit load/ CDSC collected is credited to the respective scheme net of taxes to the respective schemes as "Other Income", as against the earlier practice of crediting any amount more than 1% of the exit load to the respective schemes as "Other Income" and balance towards marketing and selling expenses - Unutilised amount of load is carried forward to the subsequent year. If the amount is considered in excess by the AMC / Trustees, then such excess amount is credited to the respective Schemes as Other Income. (g) Investor education and awareness initiatives - Effective October 01, 2012, in accordance with SEBI Circular no. CIR/IMD/DF/21/2012 dated September 13, 2012, the fund is accruing 0.02% p.a. on daily net assets towards investor education and awareness initiatives. Unutilised amount is carried forward to the subsequent year.
FRANKLIN TEMPLETON MUTUAL FUND SCHEDULE TO THE BALANCE SHEET AND REVENUE ACCOUNT FOR THE YEAR ENDED MARCH 31, 2015 (All amounts in thousands of Rupees) FRANKLIN INDIA PRIMA FUND FRANKLIN INDIA SMALLER COMPANIES FUND Quantity Amount Quantity Amount Schedules March 31, 2015 March 31, 2014 March 31, 2015 March 31, 2014 March 31, 2015 March 31, 2014 March 31, 2015 March 31, 2014 3 UNIT CAPITAL Units of Rs 10 each fully paid up Growth Plan Outstanding, beginning of year Issued during the year Redeemed during the year Outstanding, end of year 13,304,129.694 22,120,512.094 (4,856,335.094) 30,568,306.694 10,469,275.874 6,691,893.000 (3,857,039.180) 13,304,129.694 133,042 221,205 (48,563) 305,684 104,693 66,919 (38,570) 133,042 127,965,569.322 297,726,119.180 (42,593,698.921) 383,097,989.581 126,161,582.135 26,112,018.243 (24,308,031.056) 127,965,569.322 1,279,656 2,977,261 (425,937) 3,830,980 1,261,616 261,120 (243,080) 1,279,656 Dividend Plan Outstanding, beginning of year Issued during the year Redeemed during the year Outstanding, end of year 141,927,685.789 96,640,104.383 (39,806,543.965) 198,761,246.207 115,819,023.769 57,673,491.550 (31,564,829.530) 141,927,685.789 1,419,277 966,401 (398,065) 1,987,613 1,158,190 576,735 (315,648) 1,419,277 97,525,984.394 101,764,759.876 (44,526,534.257) 154,764,210.013 74,868,061.902 37,903,649.966 (15,245,727.474) 97,525,984.394 975,260 1,017,648 (445,265) 1,547,643 748,681 379,036 (152,457) 975,260 Direct Growth Plan Outstanding, beginning of year Issued during the year Redeemed during the year Outstanding, end of year 651,634.010 2,149,826.513 (506,204.500) 2,295,256.023 284,178.838 431,140.207 (63,685.035) 651,634.010 6,516 21,498 (5,062) 22,952 2,842 4,311 (637) 6,516 4,635,718.441 53,815,864.911 (6,827,280.983) 51,624,302.369 1,479,513.580 3,414,807.722 (258,602.861) 4,635,718.441 46,358 538,159 (68,273) 516,244 14,796 34,148 (2,586) 46,358 Direct Dividend Plan Outstanding, beginning of year Issued during the year Redeemed during the year 2,532,552.087 2,926,649.898 (737,421.028) 377,283.507 2,272,186.220 (116,917.640) 25,326 29,266 (7,374) 3,773 22,722 (1,169) 777,910.429 8,327,124.694 (611,760.524) 162,443.210 819,265.760 (203,798.541) 7,778 83,271 (6,118) 1,624 8,193 (2,039) Outstanding, end of year 4,721,780.957 2,532,552.087 47,218 25,326 8,493,274.599 777,910.429 84,931 7,778 Total Outstanding, beginning of year Issued during the year Redeemed during the year Outstanding, end of year 158,416,001.580 123,837,092.888 (45,906,504.587) 236,346,589.881 126,949,761.988 67,068,710.977 (35,602,471.385) 158,416,001.580 1,584,160 1,238,370 (459,064) 2,363,466 1,269,498 670,687 (356,025) 1,584,160 230,905,182.586 461,633,868.661 (94,559,274.685) 597,979,776.562 202,671,600.827 68,249,741.691 (40,016,159.932) 230,905,182.586 2,309,052 4,616,339 (945,593) 5,979,798 2,026,717 682,497 (400,162) 2,309,052 (THIS SPACE HAS BEEN INTENTIONALLY LEFT BLANK)
FRANKLIN TEMPLETON MUTUAL FUND SCHEDULES TO THE BALANCE SHEET AND REVENUE ACCOUNT FOR THE YEAR ENDED MARCH 31, 2015 (All amounts in thousands of Rupees) FRANKLIN INDIA PRIMA FUND FRANKLIN INDIA SMALLER COMPANIES FUND Schedules March 31, 2015 March 31, 2014 March 31, 2015 March 31, 2014 4. RESERVES AND SURPLUS Unit premium reserve Balance, beginning of year Net premium on issue/(redemption) of units Balance, end of year - - - - - - 1,904,986 (1,726,058) 178,928 - - - Unrealised appreciation reserve Balance, beginning of year Change in net unrealised appreciation in value of investments Balance, end of year 2,931,534 8,979,222 11,910,756 1,409,550 1,521,984 2,931,534 1,210,874 4,827,763 6,038,637 484,889 725,985 1,210,874 Retained surplus Balance, beginning of year Transfer to Revenue Account Net surplus / (Deficit) transferred from revenue account Balance, end of year 11,174,416 (11,174,416) 22,526,794 22,526,794 9,213,621 (9,213,621) 11,174,416 11,174,416 2,743,383 (2,743,383) 8,589,718 8,589,718 2,318,617 (2,318,617) 2,743,383 2,743,383 Total reserves and surplus 34,437,550 14,105,950 14,807,283 3,954,257 5. CURRENT LIABILITIES AND PROVISIONS Current Liabilities Management fees Trusteeship fees Registrar service charges Load pending utilisation Investor Education Liability Sundry creditors for units redeemed by investors Contracts for purchase of investments Dividend payable Unclaimed distributed income Unclaimed redemption payable Units pending allotment Other current liabilities 51,312 11,898 28,194 8,521 91 27 53 10 3,927 1,364 24,821 1,314 44,290 193,193 2,446 571 - - 3,085 511 10,923 14,784 2,842 53,085 21,747 1,551 15,202 56,335 538 5,488 6,160 23,614 9,597 149,178 - - 33 13,100 6,752 15,190 23,138 191,184 10,661 4,815 1,466 28,573 322,422 3,996 4,820 282 5,731 53,267 6. INVESTMENTS (i) The investments of the Scheme are registered in the name of the Fund for the benefit of the Scheme's unitholders. (ii) Aggregate appreciation and depreciation in the value of investments are as follows: Listed Equity shares / Awaiting listing on Stock Exchanges Listed Securities / Securities Awaited Listing / Unlisted Securities / Foreign Securities: (Equity shares / Preference shares / Foreign securities) - appreciation 12,008,916 3,079,863 6,337,446 1,464,351 - depreciation 98,160 148,329 298,809 253,475 Listed debentures and bonds / Awaiting listing on Stock Exchanges (Equity linked debentures / Other debentures and bonds / Securitised debt securities) - appreciation - - - - - depreciation - - - - (iii) The aggregate value of investments purchased and sold by the Scheme during the year and these amounts as a percentage of average daily net assets are as follows: Purchases - amount 15,968,992 4,447,071 11,007,583 1,212,225 - as a percentage of average daily net assets 67.13 52.48 87.09 37.75 Sales - amount 6,134,243 3,085,137 2,252,324 1,030,355 - as a percentage of average daily net assets 25.79 36.41 17.82 32.09 (iv) Amount of Debentures and bonds Listed/ Awaiting listing on Stock Exchanges not traded as on the date of financial statement. - - - - (v) During the year, the Scheme has invested in the equity shares / debentures and bonds of certain companies, which have invested in some of the schemes of the Fund in excess of five percent of those schemes' Net Assets. The Scheme's investments in these companies (except for investments in subsidiaries of these companies) as at March 31, 2015 are provided in Annexure 1. These investments have been made on account of their value at the related prices and are in accordance with the investment objectives of the Scheme.
SCHEDULES TO THE BALANCE SHEET AND REVENUE ACCOUNT FOR THE YEAR ENDED MARCH 31, 2015 (All amounts in thousands of Rupees) FRANKLIN INDIA PRIMA FUND FRANKLIN INDIA SMALLER COMPANIES FUND Schedules March 31, 2015 March 31, 2014 March 31, 2015 March 31, 2014 7. OTHER CURRENT ASSETS Cash and Bank Balance Balances with banks in current accounts Unclaimed dividend bank account Unclaimed redemption bank account 87,432 13,100 6,752 107,284 25,291 10,661 4,815 40,767 82,164 5,488 6,160 93,812 21,488 3,996 4,820 30,304 CBLO/ Reverse Repo Lending Collateralised lending/Reverse repo 3,022,531 3,022,531 785,720 785,720 2,140,683 2,140,683 290,780 290,780 Others Sundry debtors for units issued to investors Outstanding and accrued income Contracts for sale of investments Advances and deposits Margin money 20,693 7,025 9,530 7,148 131,363 4,516 16,750 169,307 16,435 1,435 - 485 - - 19,263 4,516 35,850 68,084 -* -* 21,542 39,412 9,390 29,138 TOTAL *:- Amount is less than rupees one thousand 3,197,899 995,794 2,273,907 350,222 8. ACCUMULATED UNIT DISCOUNT, NET Balance, beginning of year Net premium on ( issue) / redemption of units Balance, end of year 4,424,846 (2,008,149) 2,416,697 4,426,689 (1,843) 4,424,846 - - - 1,908,189 (3,203) 1,904,986 9. INTEREST On Collateralised lending / Reverse repo On Fixed deposits 169,958 2,158 172,116 67,490 127 67,617 103,172 26,113 575 - 103,747 26,113 10. INCOME AND EXPENDITURE The total income and expenditure and these amounts as a percentage of the Scheme’s average daily net assets on an annualised basis are provided below: Income - amount 2,396,572 1,075,944 1,238,023 480,579 - as a percentage of average daily net assets 10.07 12.70 9.80 14.97 Expenditure - amount 535,232 210,729 293,593 87,089 - as a percentage of average daily net assets Regular Plan Direct Plan 2.31 0.93 2.50 1.68 2.45 0.95 2.72 2.27 Management fees (including service tax) - amount 260,033 127,698 143,149 67,085 - as a percentage of average daily net assets Regular Plan Direct Plan 1.11 0.71 1.51 1.31 1.18 0.68 2.09 1.93 Trusteeship fees (including service tax) - amount 715 254 380 96 - as a percentage of average daily net assets 0.003 0.003 0.003 0.003 (THIS SPACE HAS BEEN INTENTIONALLY LEFT BLANK)
FRANKLIN TEMPLETON MUTUAL FUND SCHEDULES TO THE BALANCE SHEET AND REVENUE ACCOUNT FOR THE YEAR ENDED MARCH 31, 2015 11. RELATED PARTY DISCLOSURES The Scheme has entered into transactions with certain related parties. The information required in this regard in accordance with Accounting Standard 18 on ‘Related Party Disclosures’ issued by the ICAI and Regulation 25(8) of the SEBI Regulations, is provided below. Related party relationships (i) Name Description of relationship a) Where control exists Franklin Resources Inc Templeton Worldwide Inc (TWI) USA Templeton International Inc, USA Franklin Templeton Capital Holdings Pte Limited (Singapore) Franklin Templeton Asia Holdings Pte Limited (Singapore) Franklin Templeton Holding Limited , Mauritius Franklin Templeton Asset Management (India) Private Limited Franklin Templeton Trustee Services Private Limited Ultimate holding Company of the sponsor. Holding Company of the Sponsor Sponsor of the Fund. Subsidiary of the Sponsor. Sub-Subsidiary of the Sponsor Holding Company of the Scheme's Asset Manager./ Sub-Subsidiary of the Sponsor Scheme's asset manager./ Sub-subsidiary of the Sponsor Trustee of the Fund. Schemes of the Fund, under common control of the Sponsor Franklin Asian Equity Fund Franklin Build India Fund Franklin India Balanced Fund Franklin India Banking & PSU Debt Fund Franklin India Blue Chip Fund Franklin India Cash Management Account Franklin India Corporate Bond Opportunities Fund Franklin India Dynamic Accrual Fund (Formerly Franklin India Income Fund) Franklin India Dynamic PE Ratio Fund Of Funds Franklin India Feeder - Franklin European Growth Fund Franklin India Feeder - Franklin U.S. Opportunities Fund Franklin India Fixed Tenure Fund - Series XII - Plan C Franklin India Fixed Tenure Fund - Series XVI Franklin India Fixed Tenure Fund - Series XVII Franklin India Flexi Cap Fund Franklin India Government Securities Fund Franklin India High Growth Companies Fund Franklin India Income Builder Account Franklin India Income Opportunities Fund Franklin India Index Fund Franklin India Life Stage Fund of Funds Franklin India Low Duration Fund Franklin India Monthly Income Plan Franklin India Multi-Asset Solution Fund Franklin India Opportunities Fund Franklin India Pension Plan Franklin India Prima Plus Franklin India Savings Plus Fund Franklin India Short Term Income Plan Franklin India Taxshield Franklin India Treasury Management Account Franklin India Ultra Short Bond Fund Franklin Infotech Fund Templeton India Equity Income Fund Templeton India Growth Fund Templeton India Children’s Asset Plan Franklin India Prima Fund Transactions, if any, with the above mentioned related parties as defined under Accounting Standard 18 and Regulation 25(8) of the SEBI Regulations are provided below: (ii) Franklin India Prima Fund Balance as at March 31, 2014 Year Ended 2015 Balance as at March 31, 2015 Year Ended 2014 Name of related party Nature of transactions Franklin Templeton Trustee Services Private Limited Fees for trusteeship services 715 91 254 27 Franklin Templeton Asset Management (India) Private Limited Registrar service charges Fees for management services 32,582 260,033 3,927 51,312 13,448 127,698 1,364 11,898 Schemes under common control Franklin India Life Stage Fund of Funds - 20's Plan Investment in the Plan Direct Growth Plan Subscriptions (No. of units in '000) Redemptions (No. of units in '000) Net asset value of investment at balance sheet date 3 - - 6 - - 16 13 20,384 17,215 Franklin India Life Stage Fund of Funds - 30's Plan Direct Growth Plan Subscriptions (No. of units in '000) Redemptions (No. of units in '000) Net asset value of investment at balance sheet date 1 8 - - 1 7 - - 7,672 7,247 Franklin India Life Stage Fund of Funds - 40's Plan Direct Growth Plan Subscriptions (No. of units in '000) Redemptions (No. of units in '000) Net asset value of investment at balance sheet date 2 - - 2 6 - - 15 13,780 13,381 Franklin Templeton Asset Management (India) Private Limited Investment in the Plan Direct Growth Plan Subscriptions (No. of units in '000) Redemptions (No. of units in '000) Net asset value of investment at balance sheet date - - - ** - 5 Investment in the Plan Direct Dividend Plan Subscriptions (No. of units in '000) Redemptions (No. of units in '000) Net asset value of investment at balance sheet date - - - ** - - - - ITI Capital Markets Limited Commission for distribution of the Scheme's units ( # ) 107* 75*
FRANKLIN TEMPLETON MUTUAL FUND SCHEDULES TO THE BALANCE SHEET AND REVENUE ACCOUNT FOR THE YEAR ENDED MARCH 31, 2015 Franklin India Smaller Companies Fund Balance as at March 31, 2014 Year Ended 2015 Balance as at March 31, 2015 Year Ended 2014 Name of related party Nature of transactions Franklin Templeton Trustee Services Private Limited Fees for trusteeship services 380 53 96 10 Franklin Templeton Asset Management (India) Private Limited Registrar service charges Fees for management services 18,287 143,149 2,446 28,194 5,669 67,085 571 8,521 Franklin Templeton Asset Management (India) Private Limited Investment in the Plan Direct Dividend Plan Subscriptions (No. of units in '000) Redemptions (No. of units in '000) Net asset value of investment at balance sheet date - - - 5 - - Investment in the Plan Direct Growth Plan Subscriptions (No. of units in '000) Redemptions (No. of units in '000) Net asset value of investment at balance sheet date - - - ** - - # The commission is at rates similar to those offered to other distributors by the scheme. *This represents the amount paid / payable for the year and does not necessarily reflect the amount charged to the Scheme's Revenue Account. **Amount is less than rupees one thousand
SCHEDULES TO THE BALANCE SHEET AND REVENUE ACCOUNT FOR THE YEAR ENDED MARCH 31, 2015 (All amounts in thousands of Rupees) FRANKLIN INDIA PRIMA FUND FRANKLIN INDIA SMALLER COMPANIES FUND Schedules March 31, 2015 March 31, 2014 March 31, 2015 March 31, 2014 12. NET ASSET VALUE Net asset value of each unit of Rs. 10 of the Scheme Growth Plan (Rs) Direct Growth Plan (Rs) Dividend Plan (Rs) Direct Dividend Plan (Rs) 662.5217 677.2494 61.7781 63.2443 393.1705 396.8765 39.9745 40.3705 38.4581 39.1730 24.6688 25.1844 21.6999 21.8317 15.0577 15.1616 The net asset value of the Scheme's unit is determined after including unit capital and any reserves and surplus, and reducing net deficit and accumulated unit discount, if any. 13. SEGMENT REPORTING The scheme operates only in one segment viz. to primarily generate returns, based on schemes' investment objective. 14. INCOME DISTRIBUTION In case where the Surplus / (Deficit) for the period (after adjustment of income equalisation) is lower than the amount of distributed income (including tax on income distributed), the income has been distributed by the Scheme to its unitholders out of the distributable surplus available with the Scheme, which consists of the Surplus / (Deficit) for the period (after adjustment of income equalisation) and the retained earnings / accumulated reserves of earlier period(s). 15. PRIOR YEAR COMPARATIVES Prior year amounts have been reclassified, wherever applicable, to conform to the current year's presentation. (THIS SPACE HAS BEEN INTENTIONALLY LEFT BLANK)
FRANKLIN TEMPLETON MUTUAL FUND SCHEDULES TO THE BALANCE SHEET AND REVENUE ACCOUNT FOR THE YEAR ENDED MARCH 31, 2015 16. SUPPLEMENTARY INVESTMENT PORTFOLIO INFORMATION AND INDUSTRYWISE CLASSIFICATION Details of investment portfolio and industrywise classification of the Scheme's investments in each category of investments as at March 31, 2015 are presented below. The industry and company exposure are stated as a percentage of the Scheme's net assets as at March 31, 2015, as well as the aggregate investments in each investment category. Franklin India Prima Fund Percentage to Net Assets Percentage to Investment Category Industry and Company Particular Quantity Market Value Equity and Equity Related (a) Listed/Awaiting listing on Stock Exchanges Auto TVS Motor Company Limited Eicher Motors Limited 1,600,000 1,575,000 25,000 813,268 415,564 397,704 2.37 1.21 1.16 2.59 1.32 1.27 Auto Ancillaries Amara Raja Batteries Limited Apollo Tyres Limited Balkrishna Industries Limited 4,694,678 1,216,260 3,050,000 428,418 1,804,433 1,013,205 513,163 278,065 5.25 2.95 1.49 0.81 5.76 3.23 1.64 0.89 Banks Yes Bank Limited IndusInd Bank Limited Axis Bank Limited HDFC Bank Limited ING Vysya Bank Limited Karur Vysya Bank Limited City Union Bank Limited ICICI Bank Limited 11,919,828 1,998,564 1,015,138 1,449,000 760,000 685,225 1,087,184 4,724,717 200,000 5,872,028 1,630,328 899,412 811,730 777,252 641,062 591,319 457,825 63,100 17.06 4.73 2.62 2.36 2.26 1.86 1.72 1.33 0.18 18.72 5.20 2.87 2.59 2.48 2.04 1.88 1.46 0.20 Cement JK Cement Limited ACC Limited 1,227,757 927,757 300,000 1,086,804 617,979 468,825 3.16 1.80 1.36 3.46 1.97 1.49 Chemicals Pidilite Industries Limited 1,499,642 1,499,642 899,560 899,560 2.62 2.62 2.87 2.87 Construction Sobha Limited 912,437 912,437 366,845 366,845 1.07 1.07 1.17 1.17 Construction Project Voltas Limited Larsen & Toubro Limited Engineers India Limited 2,973,302 2,450,983 170,000 352,319 1,046,299 685,908 292,341 68,050 3.04 1.99 0.85 0.20 3.34 2.19 0.93 0.22 Consumer Durables Havell's India Limited Bata India Limited 1,971,269 1,600,000 371,269 893,399 488,400 404,999 2.60 1.42 1.18 2.85 1.56 1.29 0 Consumer Non Durables Kansai Nerolac Paints Limited 3,110,660 3,110,660 672,058 672,058 1.95 1.95 2.14 2.14 Fertilisers Coromandel International Limited 1,629,852 1,629,852 437,534 437,534 1.27 1.27 1.39 1.39 Finance Repco Home Finance Limited SundaramFinance Limited LIC Housing Finance Limited Credit Analysis and Research Limited Crisil Limited 3,336,496 1,206,318 467,642 1,262,995 276,833 122,708 2,688,717 770,174 709,600 552,687 409,588 246,668 7.82 2.24 2.06 1.61 1.19 0.72 8.57 2.45 2.26 1.76 1.31 0.79 Gas Gujarat State Petronet Limited Petronet LNG Limited 8,085,552 5,920,592 2,164,960 1,105,848 734,449 371,399 3.22 2.14 1.08 3.52 2.34 1.18 Hotels, Resorts and Other Recreational Activities Indian Hotels Company Limited 3,838,503 3,838,503 448,721 448,721 1.31 1.31 1.43 1.43 Industrial Capital Goods Bharat Electronics Limited Thermax Limited Crompton Greaves Limited 2,052,979 150,000 298,744 1,604,235 1,088,131 502,575 319,253 266,303 3.16 1.46 0.93 0.77 3.47 1.60 1.02 0.85 Industrial Products Finolex Cables Limited FAG Bearings (India) Limited SKF India Limited Greaves Cotton Limited 7,894,108 3,862,831 228,865 393,181 3,409,231 3,106,522 1,099,940 955,111 554,405 497,066 9.03 3.19 2.78 1.61 1.45 9.91 3.51 3.05 1.77 1.58 Media & Entertainment Jagran Prakashan Limited 1,840,992 1,840,992 237,028 237,028 0.69 0.69 0.76 0.76 Minerals/Mining Gujarat Mineral Development Corporation Limited 2,037,453 2,037,453 228,500 228,500 0.66 0.66 0.73 0.73 Paper Nirvikara Paper Mills Limited** 47,601 47,601 4,584 4,584 0.01 0.01 0.01 0.01 Pesticides Bayer Cropscience Limited PI Industries Limited Rallis India Limited 1,745,608 132,628 725,670 887,310 1,082,101 440,736 439,901 201,464 3.15 1.28 1.28 0.59 3.44 1.40 1.40 0.64 Petroleum Products Bharat PetroleumCorporation Limited Mangalore Refinery and Petrochemicals Limited 2,976,125 645,444 2,330,681 680,414 523,326 157,088 1.98 1.52 0.46 2.16 1.66 0.50 Pharmaceuticals Torrent Pharmaceuticals Limited IPCA Laboratories Limited Cadila Healthcare Limited Ajanta Pharma Limited 1,925,272 824,461 696,986 230,000 173,825 2,012,645 955,221 443,179 400,614 213,631 5.86 2.78 1.29 1.17 0.62 6.40 3.04 1.40 1.28 0.68 Power JSW Energy Limited 4,353,255 4,353,255 518,908 518,908 1.51 1.51 1.65 1.65 Software Mindtree Limited Cyient Limited Eclerx Services Limited HCL Technologies Limited 2,980,455 640,158 1,588,297 292,000 460,000 2,545,673 834,542 797,166 462,981 450,984 7.41 2.43 2.32 1.35 1.31 8.12 2.66 2.54 1.48 1.44 Telecom - Services Bharti Airtel Limited 912,167 912,167 358,755 358,755 1.04 1.04 1.14 1.14 Textile Products Himatsingka Seide Limited 2,694,294 2,694,294 216,352 216,352 0.63 0.63 0.69 0.69 Transportation Gujarat Pipavav Port Limited Gateway Distriparks Limited 4,030,498 2,923,637 1,106,861 1,162,475 707,666 454,809 3.38 2.06 1.32 3.71 2.26 1.45 Total 31,377,602 91.25 100.00 (b) Unlisted** Others HimTechno Numero Uno International Limited 178,100 170,000 8,100 2.00 2.00 0.00 0.00 0.00* 0.00* 100.00 100.00 0.00 Total 2.00 0.00* 100.00 OTHER CURRENT ASSETS 3,197,899 9.31 TOTAL ASSETS 34,575,503 100.56 LESS: CURRENT LIABILITIES 191,184 0.56 NET ASSETS 34,384,319 100.00 ** Non Traded /Thinly Traded Securites * Less than 0.01% Values of 0.00 denotes less than Rs. 0.01 thousand.
FRANKLIN TEMPLETON MUTUAL FUND SCHEDULES TO THE BALANCE SHEET AND REVENUE ACCOUNT FOR THE YEAR ENDED MARCH 31, 2015 Franklin India Smaller Companies Fund Percentage to Net Assets Percentage to Investment Category Industry and Company Particular Quantity Market Value Equity and Equity Related Listed/Awaiting listing on Stock Exchanges Auto Tata Motors Limited (DVR) 1,050,000 1,050,000 348,128 348,128 1.67 1.67 1.86 1.86 Auto Ancillaries Amara Raja Batteries Limited L.G. Balakrishnan & Brothers Limited Banco Products India Limited Wabco India Limited 2,232,914 467,741 320,863 1,421,978 22,332 842,370 389,652 177,582 147,601 127,535 4.04 1.87 0.85 0.71 0.61 4.51 2.09 0.95 0.79 0.68 Banks Yes Bank Limited Axis Bank Limited HDFC Bank Limited IndusInd Bank Limited Karur Vysya Bank Limited City Union Bank Limited ICICI Bank Limited 8,553,771 898,884 925,000 447,207 506,427 750,253 4,026,000 1,000,000 3,271,185 733,265 518,185 457,359 448,694 408,063 390,119 315,500 15.74 3.53 2.49 2.20 2.16 1.96 1.88 1.52 17.53 3.93 2.78 2.45 2.40 2.19 2.09 1.69 Cement JK Lakshmi Cement Limited Ramco Cements Limited Orient Cement Limited 2,137,067 851,622 563,565 721,880 606,065 305,562 171,972 128,531 2.92 1.47 0.83 0.62 3.25 1.64 0.92 0.69 Chemicals Pidilite Industries Limited Atul Limited Deepak Fertilizers & Petrochemicals Corporation Limited 1,720,505 683,925 306,993 729,587 857,794 410,252 347,516 100,026 4.14 1.97 1.68 0.49 4.60 2.20 1.86 0.54 Commercial Services Nesco Limited 112,487 112,487 171,953 171,953 0.84 0.84 0.92 0.92 Construction KNR Constructions Limited Sobha Limited Brigade Enterprises Limited Consolidated Construction ConsortiumLimited 4,739,110 577,036 570,583 1,256,926 2,334,565 664,837 245,125 229,403 179,803 10,506 3.20 1.19 1.10 0.86 0.05 3.56 1.31 1.23 0.96 0.06 Construction Project Voltas Limited KEC International Limited 2,653,439 1,394,932 1,258,507 491,115 390,372 100,743 2.36 1.88 0.48 2.63 2.09 0.54 Consumer Durables Hitachi Home & Life Solutions Limited Blue Star Limited 922,389 232,279 690,110 549,848 337,501 212,347 2.64 1.62 1.02 2.95 1.81 1.14 Consumer Non Durables Berger Paints India Limited Kaveri Seed Company Limited 1,194,435 1,002,590 191,845 398,128 209,190 188,938 1.92 1.01 0.91 2.13 1.12 1.01 Ferrous Metals Pennar Industries Limited 3,849,169 3,849,169 206,123 206,123 0.99 0.99 1.10 1.10 Finance Repco Home Finance Limited Geojit BNP Paribas Financial Services Limited Motilal Oswal Financial Services Limited 4,198,425 733,368 3,127,290 337,767 726,840 468,219 162,932 95,689 3.49 2.25 0.78 0.46 3.89 2.51 0.87 0.51 Gas Aegis Logistics Limited 390,839 390,839 236,907 236,907 1.14 1.14 1.27 1.27 Hotels, Resorts and Other Recreational Activities Talwalkars Better Value Fitness Limited 657,119 657,119 245,664 245,664 1.18 1.18 1.32 1.32 Industrial Capital Goods Bharat Electronics Limited Triveni Turbine Limited Voltamp Transformers Limited 1,802,285 80,000 1,560,990 161,295 573,907 268,040 202,695 103,172 2.77 1.29 0.98 0.50 3.08 1.44 1.09 0.55 Industrial Products Finolex Cables Limited FAG Bearings (India) Limited Finolex Industries Limited Greaves Cotton Limited SKF India Limited Timken India Limited M.M. Forgings Limited AIA Engineering Limited Grindwell Norton Limited CarborundumUniversal Limited Swaraj Engines Limited Shakti Pumps India Limited 10,412,975 2,536,616 113,773 1,527,252 2,776,250 278,682 522,728 423,288 209,969 316,457 1,094,898 201,210 411,852 3,973,271 722,301 474,803 433,281 404,777 392,956 319,439 287,074 262,997 221,346 208,250 162,668 83,379 19.10 3.47 2.28 2.08 1.95 1.89 1.54 1.38 1.27 1.06 1.00 0.78 0.40 21.30 3.87 2.54 2.32 2.17 2.11 1.71 1.54 1.41 1.19 1.12 0.87 0.45 Media & Entertainment Navneet Education Limited Entertainment Network India Limited TV Today Network Jagran Prakashan Limited 6,188,561 4,023,653 387,874 773,673 1,003,361 1,003,636 401,561 305,082 167,810 129,183 4.83 1.93 1.47 0.81 0.62 5.37 2.15 1.63 0.90 0.69 Minerals/Mining Gujarat Mineral Development Corporation Limited 1,365,533 1,365,533 153,145 153,145 0.74 0.74 0.82 0.82 Pesticides PI Industries Limited 464,761 464,761 281,738 281,738 1.36 1.36 1.51 1.51 Petroleum Products Gulf Oil Lubricants India Limited 650,294 650,294 331,747 331,747 1.60 1.60 1.78 1.78 Pharmaceuticals J.B. Chemicals & Pharmaceuticals Limited IPCA Laboratories Limited 1,560,282 1,264,793 295,489 440,150 252,263 187,887 2.11 1.21 0.90 2.36 1.35 1.01 Software Eclerx Services Limited Cyient Limited Mindtree Limited 1,437,601 300,759 824,710 312,132 1,297,701 476,868 413,922 406,911 6.24 2.29 1.99 1.96 6.96 2.56 2.22 2.18 Telecom - Services Bharti Airtel Limited 576,459 576,459 226,721 226,721 1.09 1.09 1.21 1.21 Textile Products Himatsingka Seide Limited 4,203,746 4,203,746 337,561 337,561 1.62 1.62 1.81 1.81 Transportation Gujarat Pipavav Port Limited 1,759,215 1,759,215 425,818 425,818 2.05 2.05 2.28 2.28 Total 18,662,352 89.78 100.00 OTHER CURRENT ASSETS 2,273,907 10.94 TOTAL ASSETS 20,936,259 100.72 LESS: CURRENT LIABILITIES 149,178 0.72 NET ASSETS 20,787,081 100.00 ** Untraded /Thinly Traded Securites
FRANKLIN TEMPLETON MUTUAL FUND SCHEDULES TO THE BALANCE SHEET AND REVENUE ACCOUNT FOR THE YEAR ENDED MARCH 31, 2015 FRANKLIN INDIA SMALLER COMPANIES FUND FRANKLIN INDIA PRIMA FUND March 31, 2015 March 31, 2014 March 31, 2015 March 31, 2014 Annexure 1 ACC Ltd. Bharti Airtel Limited Infosys Limited Larsen & Toubro Limited LIC Housing Finance Limited Tata Motors Limited (DVR) - 243,521 - - - - - - - - 358,755 - 226,721 - 163,943 190,898 - - - 292,341 552,687 - - - 348,128 574,849 1,203,783 598,362 The aggregate purchases (other than by inter-scheme transfer/sale and those already disclosed earlier) made by the Scheme in these companies, during a period of one year before or after the date of the companies' investment are as follows: ACC Limited Bharti Airtel Limited Infosys Limited Larsen & Toubro Limited LIC Housing Finance Limited Tata Motors Limited (DVR) - 151,719 - - - - - - - - 73,502 - 107,451 - 191,025 193,194 - - - 30,023 519,957 - - - 205,451 312,902 623,482 535,938
FRANKLIN INDIA PRIMA FUND FRANKLIN INDIA SMALLER COMPANIES FUND PER UNIT STATISTICS Year ended March 31, 2015 Year ended March 31, 2014 Year ended March 31, 2013 Year ended March 31, 2015 Year ended March 31, 2014 Year ended March 31, 2013 (a) Net Asset value, per unit 662.5217 677.2494 61.7781 63.2443 38.4581 39.1730 24.6688 25.1844 Growth Dirct Growth Dividend Direct Dividend 393.1705 396.8765 39.9745 40.3705 305.1948* 305.6414* 36.0072* 36.0601* 21.6999 21.8317 15.0577 15.1616 15.7341* 15.7572* 12.1774* 12.1974* Gross Income: i) Income other than profit on sale of investment, per unit Profit on sale of investment to third party, per unit Transfer to Revenue Account from past year's reserve per unit 1.80 0.35 1.26 1.12 0.33 0.31 ii) 8.34 1.70 5.53 4.08 1.75 1.43 iii) - - - - - - Aggregate of expense, write offs, amortisation and charges, per unit (2.26) (0.49) (1.33) (1.38) (0.38) (0.40) Net unrealised appreciation/(depreciation) in value of investments 37.99 9.61 8.07 3.14 3.50 0.99 45.87 9.63 Net Income, per unit (including appreciation / depreciation) 15.07 7.32 4.85 2.33 N.A. N.A. N.A. N.A. i) ii) iii) Highest traded price Lowest traded price Highest repurchase price/NAV ** N.A. N.A. N.A. N.A. N.A. N.A. N.A. N.A. 679.9436 694.3313 63.4027 64.8396 38.8856 39.5619 26.3708 26.8392 Growth Plan Direct Growth Plan Dividend Plan Direct Dividend Plan 389.2388 392.9077 39.5748 39.9668 332.6405 333.1760 39.2453 39.3084 21.4829 21.6134 14.9071 15.0100 17.2506 17.2511 15.9723 15.9728 iv) Highest resale price ** 686.8117 701.3447 64.0431 65.4945 39.2784 39.9615 26.6372 27.1103 Growth Plan Direct Growth Plan Dividend Plan Direct Dividend Plan 393.1705 396.8765 39.9745 40.3705 336.0005 336.0336 39.6417 39.6456 21.6999 21.8317 15.0577 15.1616 17.4248 17.4254 16.1336 16.1341 v) Lowest repurchase price/NAV ** 388.3464 392.0132 39.4841 39.8758 21.4148 21.5451 14.8599 14.9626 Growth Plan Direct Growth Plan Dividend Plan Direct Dividend Plan 275.1350 276.3296 27.9736 28.1087 249.0793 298.9192 30.3695 35.2670 14.4351 14.4830 11.1720 11.2110 12.6983 15.4272 11.7575 11.9419 vi) Lowest resale price ** 392.2691 395.9729 39.8829 40.2786 21.6311 21.7627 15.0100 15.1137 Growth Plan Direct Growth Plan Dividend Plan Direct Dividend Plan 277.9141 279.1208 28.2562 28.3926 251.5953 301.9386 30.6763 35.6232 14.5809 14.6293 11.2848 11.3242 12.8266 15.5830 11.8763 12.0625 Ratio of Expenses to Average Net Assets Regular Plan Direct Plan Ratio of Gross Income to Average Net Assets 2.31 0.93 47.82 2.50 1.68 30.66 2.33 1.7 14.68 2.45 0.95 47.99 2.72 2.27 37.57 2.5 2.08 17.02 N.A. N.A. (g) P.E. Ratio N.A. N.A. N.A. N.A. *Non-business day NAV computed for disclosure purposes only **Per unit calculation is based on number of units at the end of the year. The highest and lowest resale pricce has been determined, after adding to the NAV, the maximum entry load applicable. Per unit statistics are disclosed for schemes/plans in existence at the end of respective years.