Content
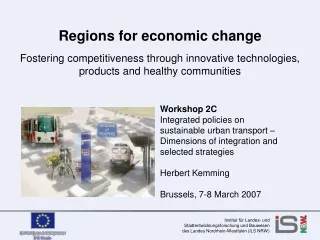
Shonali Pachauri and Daniel Spreng Some remarks on the choice and use of indicators of development. Content. General considerations Time scale and level of aggregation (number of people, geographic space) Degree of change Where is it happening? In function of what is it happening?


Content
E N D
Presentation Transcript
Shonali Pachauri and Daniel Spreng Some remarks on the choice and use of indicators of development
Content • General considerations • Time scale and level of aggregation (number of people, geographic space) • Degree of change • Where is it happening? • In function of what is it happening? • Example: Energy use and number of people per family • Naïve view • Decrease of family size: an important attribute of development • Informed view • Conclusions
Services 1940 2020 Time scale Employment in the three sectors (Switzerland) Services Industry & trade Agriculture
Level of aggregation Traditional fuel Modern fuel E Country: Household: ECountry =SEHouseholds (transitions taking place over the years) time ? ? ? E E E time time time
Degree of change Traditional fuel Modern fuel E Country: Household: ECountry =SEHouseholds (transitions taking place over the years) time ? ? ? E E E time time time
E time Clearly a transformation: Depict what is coming to an end Household: Traditional fuel Modern fuel ECountry =SEHouseholds (transitions taking place over the years)
Where is it happening? Calculations based on NSS data, round 55 (year 1999-2000).
Electrificationof the districts Calculations based on NSS data, round 55 (year 1999-2000).
Level of aggregation • Person • Household • Village/district …. occupational group …. decile …or group with specific characterisation • Country • Globe
The search for groups Two years of cluster analysis with household survey data (sample of 30'000 to 120'000 HH) with about 200 consumption items. We were looking for “stable” groups like: • Tribes people • Rural unemployed and landless peasants • Traditional merchants and craftsmen • Peasants with small farms • Big farmers • The urban poor • Blue-collar employees of western-style firms and factories • Servants • The new middle class • The upper class
Useful energy Examples of energy services, which may be available in the given intervalsof useful energy Access Less than 15 watt/capita Less than one warm meal per day, a kerosene lamp, possibly a little hot water 15-30 watt/capita One to two warm meals per day (for farmers and manual labourers below basic need), a few kerosene lamps or one electric bulb, some hot water 30-60 watt/capita Two warm meals per day ( perhaps “farmers portions”), hot water and light. Perhaps small electric appliances (TV, tele-phone, fridge) for groups with electrici-ty. Possibly scooter. More than 60 watt/capita Two or more warm meals, hot water, lighting, some space heating and – for groups with electri-city, possibly space cooling, plus other electric appliances. Possibly scooter, car. Biomass and Kerosene Electricity, biomass and/or Kerosene LPG, Electricity and possibly others The Energy Access-Consumption Matrix Examples of type of information analyzed: Nos of people % of people % Literate % Rural % with Tap water Avg p.c land holding Avg p.c. expenditure
Energy Poverty and Energy Distribution Pachauri, S., Mueller, A., Kemmler, A. and Spreng, D. (2004) On Measuring Energy Poverty in Indian Households World Development 32 (12) 2083-2104 Social development
Who is deciding? • Electrification: distinct decisions • In states, districts and villages by the utilities • But also of the households • Switch to clean cooking fuels • Initially some decisions required in the supply chain • But mainly a decision for the households
In function of what are decisions taken? • Electrification: distinct decisions • In states, districts and villages by the utilities • But also of the households • More a question of whether to step out of the poverty trap and join the “western” technological world or not rather than an economic question • Switch to clean cooking fuels • Initially some decisions required in the supply chain • But mainly a decision for the households • Both an economic question and • A question of attitude of household heads towards women
Energy as a function of what –on which level of aggregation? • A given function on one level will not necessarily translate into the same function at a different level of aggregation • Indicators relevant to some decisions may not be relevant to other decisions • What follows is an example of this: energy use as a function of household size
The naïve, bottom-up view Smaller households higher per capita energy use – economies of scale Source: Indian Household Consumer Surveys, NSSO, GoI, various years
Drivers of Change in Family Size Multiplicative relationship between driving forces Economic growth Urbanization Education Access to better health services Demographic Transition Health Transition Family size Fewer communi-cable diseases, more non-communicable Lower mortality – longer lives Lower fertility – fewer births Family relations formation and dissolution Hygiene and cleanliness Gender roles Culture and traditions
Differences in Family Size – A Broader View Implications for energy and development – What is the composition and characteristic of larger households? • Evidence from the USA: • Larger house-holds are poorer per capita • Larger house-holds are com-posed of more children • Larger house-holds tend to have members in the middle age group Source: O’Neill & S.Chen 2002