Download
1 / 7
70 likes | 221 Vues
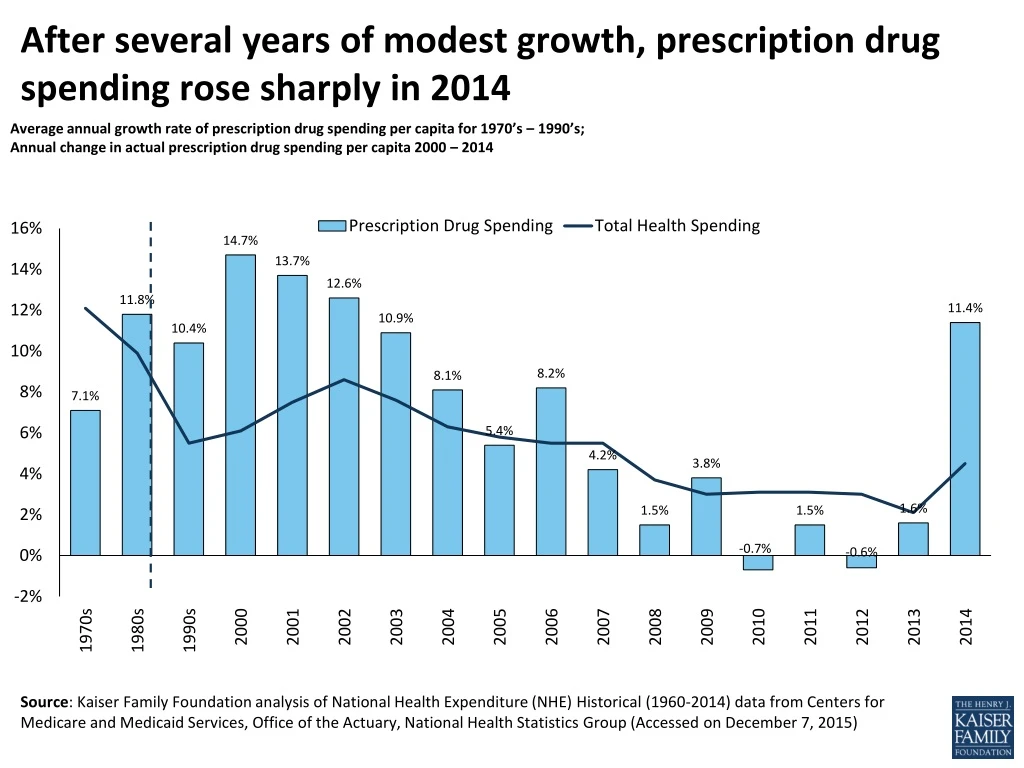
After several y ears of modest g rowth , prescription drug spending r ose sharply in 2014. Average annual growth rate of prescription drug spending per capita for 1970’s – 1990’s; Annual change in actual prescription drug spending per capita 2000 – 2014.

E N D
After several years of modest growth, prescriptiondrug spending rose sharply in 2014 Average annual growth rate of prescription drug spending per capita for 1970’s – 1990’s; Annual change in actual prescription drug spending per capita 2000 – 2014 Source: Kaiser Family Foundation analysis of National Health Expenditure (NHE) Historical (1960-2014) data from Centers for Medicare and Medicaid Services, Office of the Actuary, National Health Statistics Group (Accessed on December 7, 2015)
Costly new specialty drugs are a major driver of increased health spending Express Scripts drug spending growth trend by therapy class, 2006 -2014 Source: Express Scripts 2014 Drug Trend Report and Year in Review. Available at http://lab.express-scripts.com/drug-trend-report/ and http://lab.express-scripts.com/drug-trend-report/introduction/year-in-review
Medicare has become a major payer for prescription drugs Distribution of total national health expenditures on retail prescription drugs, by payer, 2004 and 2014 Source: Kaiser Family Foundation analysis of National Health Expenditure (NHE) data from Centers for Medicare and Medicaid Services, Office of the Actuary, National Health Statistics Group Note: The increase in Medicare spending on prescription drugs is largely due to the 2006 addition of the Medicare prescription drug benefit.
Most people taking Rx drugs say they can afford their treatment, but about 1 in 4 have a difficult time affording their medicine Among those who are currently taking Rx medicine, percent who report ease or difficulty affording the cost of their prescription medications Source: Kaiser Family Foundation Health Tracking Poll (conducted Aug 6 – 11, 2015)
The average price of Humira is about 15% higher in the U.S. than in Canada Average price for 1-month supply, 2013 Source: International Federation of Health Plans Notes: U.S. average prices are calculated using commercial claims data from TruvenMarketScan Research databases. Methods and sources for comparable countries can be found here: http://www.ifhp.com/1404121
The average price of Enbrel in the U.S. is about 35% higher than in Canada Average price for 1-month supply, 2013 Source: International Federation of Health Plans Notes: U.S. average prices are calculated using commercial claims data from TruvenMarketScan Research databases. Methods and sources for comparable countries can be found here: http://www.ifhp.com/1404121
Most Americans favor action to keep drug prices down Percent who say they favor each of the following in keeping prescription drug costs down: Source: Kaiser Family Foundation Health Tracking Poll (conducted August 6-11, 2015)