Valuing Common Stocks
Valuing Common Stocks. Fundamentals of Corporate Finance Chapter 7 BMM Finansiell ekonomi LiU 2012. Keep in mind. Present value concepts can be applied to the valuation of common stocks the relationship between stock price, earnings per share EPS and growth rate g


Valuing Common Stocks
E N D
Presentation Transcript
Valuing Common Stocks Fundamentals of Corporate Finance Chapter 7 BMM FinansiellekonomiLiU 2012
Keep in mind • Present value concepts can be applied to the valuation of common stocks • the relationship between stock price, earnings per share EPS and growth rate g • learn the process of estimating the cost of equity
Learning objectives • Market Values, Book Values, and Liquidation Values • How to value Common Stocks • Simplifying the Dividend Discount Model (the discounted cash flow model) • Growth Stocks and Income Stocks • There Are No Free Lunches on Wall Street
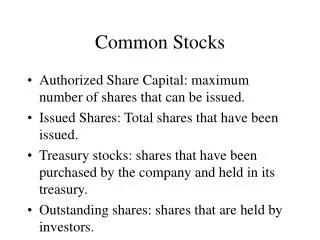
Concepts and definitions Primary Market - Market for the sale of new securities by corporations. Secondary Market - Market in which previously issued securities are traded among investors. Common Stock - Ownership shares in a publicly held corporation.
Some concepts Book Value: Net worth of the firm according to the balance sheet. Dividend: Periodic cash distribution from the firm to the shareholders. P/E Ratio: Price per share divided by earnings per share. Earnings per share: EPS = Earnings/ number of shares ROE: return on equity= Earnings /Book value of equity Note, earnings =net income= årsresultat= vinst
Going concern value • The difference between a firm’s actual market value and its’ liquidation value is the so called “going concern value.” Market value-Liquidation Value = Going concern value Liquidation Value Net proceeds that could be realized by selling the firm’s assets and paying off its creditors.
Valuation of common stocks Single period investment case • The (present) value of a common stock equals the present value of dividends expected during the period plus the present value of the expected end-of-period price. The present valueoffuture cash flows from a stock is alsocalled the Intrinsicvalueof the stock.
The DCF model: discounted cash flow method (Dividend Discount Model) The value of any stock is the present value of its future cash flows. Dividends represent the future cash flows of the firm.
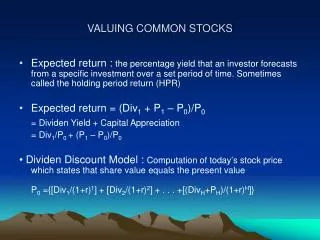
How Common Stocks Are Valued Expected Return r The percentage yield that an investor forecasts from a specific investment over a set period of time.
No growth means all earnings are paid to shareholders. Valuing Common Stocks For a stock with no growth, and assuming the stock will exist indefinitely, we can value the stock as a PERPETUITY.
How Common Stocks Are Valued Example: If Blue Sky is selling for $100 per share today and is expected to sell for $110 one year from now, what is the expected return if the dividend one year from now is forecasted to be $5.00?
How Common Stocks Are Valued The price of any share of stock can be thought of as the present value of the futures cash flows. For a stock the future cash flows are dividends and the ultimate sales price of the stock. Present value of one period return
How Common Stocks Are Valued Example - continued: Blue Sky price can be thought of as follows.
Given any combination of variables in the equation, you can solve for the unknown variable. Valuing Common Stocks Constant Growth DDM - A version of the dividend growth model in which dividends grow at a constant rate (Gordon Growth Model).
Example: valuing stocks What is the value of the stock that expects to pay a $3.00 dividend next year, and then increase the dividend at a rate of 8% per year, indefinitely? Assume a 12% expected return. (note: suppose that Blue Sky invested 40% back to the company, the dividend becomes 5*60%=3.)
Estimating the Cost of Equity Capital Dividend Growth Rate can also be derived from applying the return on equity to the percentage of earnings plowed back into operations. g = return on equity X plowback ratio
H - Time horizon for your investment. Valuing Common Stocks Dividend Discount Model - Computation of today’s stock price which states that share value equals the present value of all expected future dividends.
How Common Stocks Are Valued Formula
How Common Stocks Are Valued Example Blue Sky is forecasted to pay a $5.00 dividend at the end of year one and a $5.50 dividend at the end of year two. At the end of the second year the stock will be sold for $121. If the discount rate is 15%, what is the price of the stock?
How Common Stocks Are Valued Example Current forecasts are for Blue Sky to pay dividends of $3, $3.24, and $3.50 over the next three years, respectively. At the end of three years you anticipate selling your stock at a market price of $94.48. What is the price of the stock given a 12% expected return?
How Common Stocks Are Valued Example Current forecasts are for Blue Sky to pay dividends of $3, $3.24, and $3.50 over the next three years, respectively. At the end of three years you anticipate selling your stock at a market price of $94.48. What is the price of the stock given a 12% expected return?
Estimating the Cost of Equity Capital Example– A stock was selling for $42.45 per share at the start of 2012. Dividend payments for the next year were expected to be $1.68 a share. What is the dividend yield?
Estimating the Cost of Equity Capital Example - continued - Northwest Natural Gas stock was selling for $42.45 per share at the start of 2009. Dividend payments for the next year were expected to be $1.68 a share. What is the expected return, assuming a growth rate of 6.1%?
Estimating the Cost of Equity Capital Required Return Measurements
Estimating the Cost of Equity Capital • Valuing Non-Constant Growth The H period has a share value PH it is evaluated as a growing perpetuity
Estimating the Cost of Equity Capital Example – Phoenix produces dividends in three consecutive years of 0, 0.31, and 0.65, respectively. The dividend in year four is estimated to be .67 and should grow in perpetuity at 4%. Given a discount rate of 10%, what is the price of the stock? Note here the discount factor is 1/(1+0,1)3
Stock Price and Earnings Per Share • If a firm chooses to pay a lower dividend, and reinvest the funds, the stock price may increase because future dividends may be higher. Payout Ratio: Fraction of earnings paid out as dividends Plowback Ratio: Fraction of earnings retained by the firm The payout ratio= 1-Plowback ratio
Stock Price and Earnings Per Share Example Our company forecasts to pay a $8.33 dividend next year, which represents 100% of its earnings. This will provide investors with a 15% expected return. Instead, we decide to retain 40% of the earnings at the firm’s current return on equity of 25%. What is the value of the stock before and after the earnings distribution decision?
Example • Pay a $8.33 dividend next year, which represents 100% of its earnings. a 15% expected return. • plowback 40% of the earnings at the firm’s current return on equity of 25%. the value of the stock with and without growth: No Growth With Growth With growth of the equity, the price of the share worth more than before! 100-55,56=44,44
Stock Price and Earnings Per Share Example - continued If the company did not plowback some earnings, the stock price would remain at $55.56. With the plowback, the price rose to $100.00. The difference between these two numbers is called the Present Value of Growth Opportunities (PVGO). Remain critical! The growth rate of dividend 10% would amount to huge payment after 10 year! Especially when it is close to the discount rate. (r-g should be larger than 0). The stock price will explode!
Stock Price and Earnings Per Share Present Value of Growth Opportunities (PVGO): Net present value of a firm’s future investments. Sustainable Growth Rate is the steady rate at which a firm can grow: g = plowback ratio X return on equity.
Valuing a Business Valuing a Business or Project The value of a business or Project is usually computed as the discounted value of FCF out to a valuation horizon (H). The valuation horizon is sometimes called the terminal value.
Valuing a Business Valuing a Business or Project PV (free cash flows) PV (horizon value)
Sustainable growth • Long-term growth rate in dividends is a function of Plowback ratio and return on equity. • Growth rate of equity=g • ROE= Earning/equity= (1+g)Earnings/(1+g)equity The second year will have (1+g) Earnings to distribute to shareholders. Keep the payout ratio constant, we will have an dividend growth (1+g).
No Free Lunches • Technical Analysts • Investors who attempt to identify undervalued stocks by searching for patterns in past stock prices. • Forecast stock prices based on the watching the fluctuations in historical prices (thus “wiggle watchers”)
No Free Lunches Scatter Plot of NYSE Composite Index over two successive weeks. Where’s the pattern?
Random Walk Theory • Security prices change randomly, with no predictable trends or patterns. • Statistically speaking, the movement of stock prices is random (skewed positive over the long term).
Random Walk Theory Coin Toss Game Heads $106.09 Heads $103.00 $100.43 Tails $100.00 Heads $100.43 $97.50 Tails $95.06 Tails
Random Walk Theory Market Index 1,300 1,200 1,100 Cycles disappear once identified Last Month This Month Next Month
Another Tool • Fundamental Analysts • Investors who attempt to find mispriced securities by analyzing fundamental information, such as accounting data and business prospects. • Research the value of stocks using NPV and other measurements of cash flow
Efficient Market Theory Efficient Market - Market in which prices reflect all available information. • Weak Form Efficiency • Market prices reflect all historical information • Semi-Strong Form Efficiency • Market prices reflect all publicly available information • Strong Form Efficiency • Market prices reflect all information, both public and private
Efficient Market Theory Announcement Date
Market Anomalies • Existing Anomalies • The Earnings Announcement Puzzle • The New-Issue Puzzle • Old Anomalies • The Small Firm Effect • The January Effect • The PE Effect • The Neglected Firm Effect • The Value Line Effect
Behavioral Finance • Attitudes towards risk • Beliefs about probabilities
Thank you! Problems? yinghong.chen@liu.se