Download
1 / 43
430 likes | 703 Vues
Outline 5: Stock & Bond Valuation. Bond Characteristics Bond Prices and Yields Stocks and the Stock Market Book Values, Liquidation Values and Market Values Valuing Common Stocks Simplifying the Dividend Discount Model Growth Stocks and Income Stocks Market Analysis. Bonds. Terminology

E N D
Outline 5: Stock & Bond Valuation • Bond Characteristics • Bond Prices and Yields • Stocks and the Stock Market • Book Values, Liquidation Values and Market Values • Valuing Common Stocks • Simplifying the Dividend Discount Model • Growth Stocks and Income Stocks • Market Analysis
Bonds Terminology • Bond - Security that obligates the issuer to make specified payments to the bondholder. • Coupon - The interest payments made to the bondholder. • Face Value(Par Value or Maturity Value) - Payment at the maturity of the bond. • Coupon Rate - Annual interest payment, as a percentage of face value.
Bonds WARNING The coupon rate IS NOT the discount rate used in the Present Value calculations. The coupon rate merely tells us what cash flow the bond will produce. Since the coupon rate is listed as a %, this misconception is quite common.
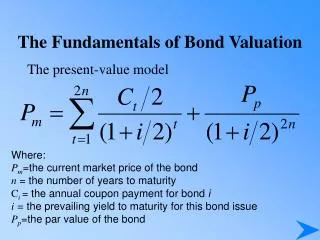
Bond Pricing The price of a bond is the Present Value of all cash flows generated by the bond (i.e. coupons and face value) discounted at the required rate of return.
Bond Pricing Example What is the price of a 6.5 % annual coupon bond, with a $1,000 face value, which matures in 3 years? Assume a required return of 3.9%.
Bond Pricing Example (continued) What is the price of the bond if the required rate of return is 6.5 %?
Bond Pricing Example (continued) What is the price of the bond if the required rate of return is 15 %?
Bond Pricing Example (continued) Q: How did the calculation change, given semi-annual coupons versus annual coupon payments? Time Periods Paying coupons twice a year, instead of once doubles the total number of cash flows to be discounted in the PV formula. Discount Rate Since the time periods are now half years, the discount rate is also changed from the annual rate to the half year rate.
Bond Yields • Current Yield - Annual coupon payments divided by bond price. • Yield To Maturity - Interest rate for which the present value of the bond’s payments equal the price.
Bond Yields Calculating Yield to Maturity (YTM=r) If you are given the price of a bond (PV) and the coupon rate, the yield to maturity can be found by solving for r.
Bond Yields Example What is the YTM of a 6.5 % annual coupon bond, with a $1,000 face value, which matures in 3 years? The market price of the bond is $1,072.29.
Bond Yields Rate of Return - Earnings per period per dollar invested.
Interest Rate Risk Price path for Premium Bond Price path for Discount Bond Maturity Today
Interest Rate Risk When the interest rate equals the 6.5% coupon rate, both bonds sell at face value 30 yr bond 3 yr bond
Nominal and Real rates Yield on UK nominal bonds Yield on UK indexed bonds
Default Risk • Credit risk • Default premium • Investment grade • Junk bonds
Corporate Bonds • Zero coupons • Floating rate bonds • Convertible bonds
The Yield Curve Term Structure of Interest Rates - A listing of bond maturity dates and the interest rates that correspond with each date. Yield Curve - Graph of the term structure.
Stocks & Stock Market Primary Market - Place where the sale of new stock first occurs. Initial Public Offering (IPO) - First offering of stock to the general public. Seasoned Issue - Sale of new shares by a firm that has already been through an IPO
Stocks & Stock Market Common Stock - Ownership shares in a publicly held corporation. Secondary Market - market in which already issued securities are traded by investors. Dividend - Periodic cash distribution from the firm to the shareholders. P/E Ratio - Price per share divided by earnings per share.
Stocks & Stock Market Book Value - Net worth of the firm according to the balance sheet. Liquidation Value - Net proceeds that would be realized by selling the firm’s assets and paying off its creditors. Market Value Balance Sheet - Financial statement that uses market value of assets and liabilities.
Valuing Common Stocks Expected Return- The percentage yield that an investor forecasts from a specific investment over a set period of time. Sometimes called the holding period return (HPR).
Valuing Common Stocks The formula can be broken into two parts. Dividend Yield + Capital Appreciation
Valuing Common Stocks Dividend Discount Model - Computation of today’s stock price which states that share value equals the present value of all expected future dividends. H - Time horizon for your investment.
Valuing Common Stocks Example Current forecasts are for XYZ Company to pay dividends of $3, $3.24, and $3.50 over the next three years, respectively. At the end of three years you anticipate selling your stock at a market price of $94.48. What is the price of the stock given a 12% expected return?
Valuing Common Stocks Example Current forecasts are for XYZ Company to pay dividends of $3, $3.24, and $3.50 over the next three years, respectively. At the end of three years you anticipate selling your stock at a market price of $94.48. What is the price of the stock given a 12% expected return?
Assumes all earnings are paid to shareholders. Valuing Common Stocks If we forecast no growth, and plan to hold out stock indefinitely, we will then value the stock as a PERPETUITY.
Given any combination of variables in the equation, you can solve for the unknown variable. Valuing Common Stocks Constant Growth DDM - A version of the dividend growth model in which dividends grow at a constant rate (Gordon Growth Model).
Valuing Common Stocks Example What is the value of a stock that expects to pay a $3.00 dividend next year, and then increase the dividend at a rate of 8% per year, indefinitely? Assume a 12% expected return.
Valuing Common Stocks Example- continued If the same stock is selling for $100 in the stock market, what might the market be assuming about the growth in dividends? Answer The market is assuming the dividend will grow at 9% per year, indefinitely.
Valuing Common Stocks • If a firm elects to pay a lower dividend, and reinvest the funds, the stock price may increase because future dividends may be higher. Payout Ratio - Fraction of earnings paid out as dividends Plowback Ratio - Fraction of earnings retained by the firm.
Valuing Common Stocks Growth can be derived from applying the return on equity to the percentage of earnings plowed back into operations. g = return on equity X plowback ratio
Valuing Common Stocks Example Our company forecasts to pay a $5.00 dividend next year, which represents 100% of its earnings. This will provide investors with a 12% expected return. Instead, we decide to plow back 40% of the earnings at the firm’s current return on equity of 20%. What is the value of the stock before and after the plowback decision?
Valuing Common Stocks Example Our company forecasts to pay a $5.00 dividend next year, which represents 100% of its earnings. This will provide investors with a 12% expected return. Instead, we decide to blow back 40% of the earnings at the firm’s current return on equity of 20%. What is the value of the stock before and after the plowback decision? No Growth With Growth
Valuing Common Stocks Example - continued If the company did not plowback some earnings, the stock price would remain at $41.67. With the plowback, the price rose to $75.00. The difference between these two numbers (75.00-41.67=33.33) is called the Present Value of Growth Opportunities (PVGO).
Valuing Common Stocks Present Value of Growth Opportunities (PVGO) - Net present value of a firm’s future investments. Sustainable Growth Rate - Steady rate at which a firm can grow: plowback ratio X return on equity.
Market Analysis • Technical Analysts • Forecast stock prices based on the watching the fluctuations in historical prices
Random Walk Theory • The movement of stock prices from day to day DO NOT reflect any pattern. • Statistically speaking, the movement of stock prices is random (skewed positive over the long-term).
Market Analysis • Fundamental Analysts • Research the value of stocks using NPV and other measurements of cash flow
Efficient Market Theory • Weak Form Efficiency • Market prices reflect all historical information • Semi-Strong Form Efficiency • Market prices reflect all publicly available information • Strong Form Efficiency • Market prices reflect all information, both public and private
Efficient Market Theory Announcement Date