Download
1 / 20
200 likes | 428 Vues
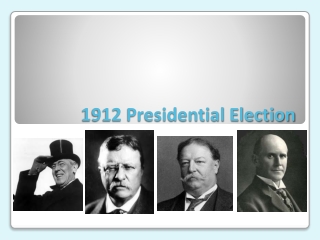
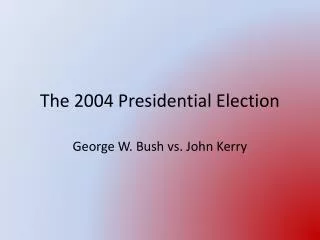
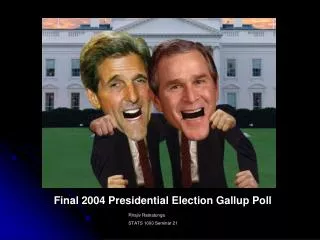
2004 Presidential Election. The following two slides show each candidate’s predicted percentage of votes from the polls taken two weeks before the election. Who do you think won?. Candidate 1: Candidate 2:. How was the data misrepresented?. By the Scale that was chosen

E N D
2004 Presidential Election The following two slides show each candidate’s predicted percentage of votes from the polls taken two weeks before the election.
How was the data misrepresented? • By the Scale that was chosen • By the Interval that was chosen
Ways to misrepresent data • By the Scale that is chosen • By the Interval that is chosen • Not starting at 0 • No title • No labels
These graphs represent the increase in cellular phone use from 1990 to 2000. Which graph makes it look like there was a greater increase in cell phone use?
These graphs represent the number of cars sold by a particular dealership from 1995 to 1999. Which graph makes it look like there was little decrease in sales?
Other ways to misrepresent data….. In a company, there are 10 employees that make $10,000 a year. The boss makes $80,000 a year. A job recruiter tells interested applicants that the typical salary for the company is $16,363 a year.
What measure (mean, median, or mode) did the job recruiter use? • Mean • What measure should the job recruiter have used? • Median
When do we use Mean, Median, or Mode? • Mean—when the data values are close together. • Median—when there are extreme values. Be sure there are no big gaps in the middle of the data. • Mode—when there are many identical numbers.
Ways to Misrepresent Data • By the Scale that is chosen • By the Interval that is chosen • Not starting at 0 • No title • No labels • Using an inappropriate measure of center (mean, median, or mode).
Sources • http://www.glencoe.com/sec/math/prealg/prealg03/extra_examples/chapter12/lesson12_5.pdf • http://images.google.com/imgres?imgurl=http://www.ced.appstate.edu/~goodmanj/workshops/ABS04/graphs/chevrolet.jpg&imgrefurl=http://www.ced.appstate.edu/~goodmanj/workshops/ABS04/graphs/graphs.html&h=640&w=479&sz=99&tbnid=r1-8gyPpdXUJ:&tbnh=135&tbnw=101&hl=en&start=7&prev=/images%3Fq%3Dmisleading%2Bgraphs%26svnum%3D10%26hl%3Den%26lr%3D%26rls%3DGGLD,GGLD:2005-16,GGLD:en%26sa%3DN • Cnn.com