Download
1 / 1
10 likes | 120 Vues
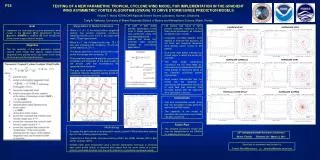
Testing and implementation of a new parametric tropical cyclone wind model in the GWAVA algorithm to enhance storm surge prediction accuracy. The model parameters are optimized for better fitting of tangential wind profiles. Results show improved performance in depicting realistic wind structures around cyclones. Future plans include implementing the model for storm surge prediction.

E N D
P24 TESTING OF A NEW PARAMETRIC TROPICAL CYCLONE WIND MODEL FOR IMPLEMENTATION IN THE GRADIENT WIND ASYMMETRIC VORTEX ALGORITHM (GWAVA) TO DRIVE STORM SURGE PREDICTION MODELS Vincent T. Wood, NOAA/OAR/National Severe Storms Laboratory, Norman, Oklahoma Craig A. Mattocks, University of Miami/Rosenstiel School of Marine and Atmospheric Science, Miami, Florida Goal • Implement our new tropical cyclone parametric wind model in the Gradient Wind Asymmetric Vortex Algorithm (GWAVA) to improve the wind forcing that drives storm surge prediction models. Interpretation of Model Parameters • When k > 1 (k < 1), the radial profile of tangential velocity has positive (negative) curvature, meaning that the curve turns to left (right) with small (see figure below). • When k = 1, the V-shaped profile near = 0 has zero curvature with increasing until the profile reaches at = 1. • The decay exponent n mainly governs the outer profile that decays with increasing . • The power-law exponent explicitly controls the broadness and sharpness of the peak locally in the annular zone that encompasses the tangential wind maximum. • The gray, thick curve represents the normalized (idealized) Rankine tangential velocity profile for comparison (see figure below). • At each of 360 radial profiles, optimization of the initial 5 model parameters was performed using the Levenberg-Marquardt method that solves the nonlinear least squares problem for curve-fitting applications. Left panels (see figure at right) present azimuthal variations of the fitted model parameters, as indicated by different color curves). Calculated root-mean-squares were applied to evaluate the accuracy of the fitted and analytical tangential wind profiles (green curves in left panels). Blue circle (right panel) indicates the limited region in which the winds (kt) are fitted. The fitted model parameters reconstruct the 2-D wind fields (kt, red contours) by interpolating the 360 radial profiles of fitted wind speed to the Cartesian coordinate system (right panel). Right panels demonstrate that the model has the capability of reproducing the asymmetric structure of wind field (red contours) that favorably agrees with the observed wind field (black contours). HURRICANE IKE HURRICANE IGOR Objective • Test the versatility of the new parametric tropical cyclone wind model that depicts realistic-looking tangential wind profiles which can better fit the wind structure around the tropical cyclone. HURRICANE DANIELLE HURRICANE EARL TROPICAL STORM DOLLY HURRICANE KATRINA Conclusions • Test and comparative results show that the parametric model performs well with low RMS values. • The capability of the model to reproduce the asymmetric wind fields has been examined. Future Plan • The versatile parametric model will soon be implemented in the GWAVA for predicting storm surge. Methodology • To assess the performance of the parametric model, gridded H*Wind fields were used as input for the following tropical cyclones: Tropical Storm Dolly (2008), Hurricanes Katrina (2005), Ike (2008), Danielle (2010), Earl (2010), and Igor (2010) • Gridded fields were interpolated using a bilinear interpolation technique to construct each radial profile (black) of observed wind speed from the storm center at a given azimuth (clockwise direction from the north) defined in a cylindrical coordinate system. 65th Interdepartmental Hurricane Conference Miami, Florida February 28 – March 3, 2011 Questions or comments may be sent to: Vincent.Wood@noaa.gov or cmattock@rsmas.miami.edu