Download
1 / 15
170 likes | 379 Vues
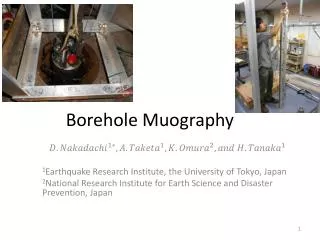
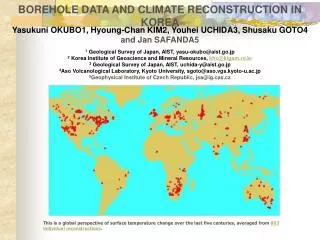
BOREHOLE DATA AND CLIMATE RECONSTRUCTION IN KOREA Yasukuni OKUBO 1 , Hyoung-Chan KIM 2 , Youhei UCHIDA 3 , Shusaku GOTO 4 and Jan SAFANDA 5 1 Geological Survey of Japan, AIST, yasu-okubo@aist.go.jp 2 Korea Institute of Geoscience and Mineral Resources, khc@kigam.re.kr

E N D
BOREHOLE DATA AND CLIMATE RECONSTRUCTION IN KOREA Yasukuni OKUBO1, Hyoung-Chan KIM2, Youhei UCHIDA3, Shusaku GOTO4 and Jan SAFANDA5 1 Geological Survey of Japan, AIST, yasu-okubo@aist.go.jp 2 Korea Institute of Geoscience and Mineral Resources,khc@kigam.re.kr 3 Geological Survey of Japan, AIST, uchida-y@aist.go.jp 4Aso Volcanological Laboratory, Kyoto University, sgoto@aso.vgs.kyoto-u.ac.jp 5Geophysical Institute of Czech Republic, jsa@ig.cas.cz This is a global perspective of surface temperature change over the last five centuries, averaged from 863 individual reconstructions.
Heat flow densities on the geological map of Korea (GSJ and KIGAM, 2002).
Examples of measurements Deep enough Old enough Not over-flowing Important Litho. T-dif. Hydrodynamic free
39 126 127 128 129 130 131 39 Gapyung 38 38 Seoul 37 37 36 36 Ulsan 35 35 Synoptic station 34 34 Borehole km 0 50 100 150 200 33 33 126 127 128 129 130 131 Location of boreholes(●) and meteoric stations(▲).
Temperature – depth data of Seoul Crystalline rock
Temperature – depth data of Gapyung Sedimentary rock
Temperature – depth data of Ulsan Sedimentary rock
Inversion (T - T0 ) / (Ts - T0 ) = erfc [ z / (2 ( k t ) 1/2 ) ] tiis time step Tiis temperature difference between ti - tI+1 G is geothermal gradient Unknown parameters in the inversion are T0 , Ti , G, k , which are independent of depth. The time step is fixed to be 5 years in this case.
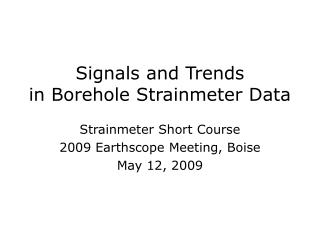
Reconstructed surface temperature and Reconstructed borehole temperaturein Seoul <90 m 90-140 m 1700-1800AD mid-20th >150 m Red curve indicates the reconstructed surface temperature. Two blue lines show the range of standard deviation 1. Black fluctuating lines denote observed surface temperatures.
Reconstructed surface temperature and Reconstructed borehole temperaturein Gapyung <80 m mid-20th 50-200 m
Reconstructed surface temperature and Reconstructed borehole temperaturein Ulsan 50-110 m mid-20th Till 1900AD 110-320 m
DISCUSSION 1 Surface temperature increase over the last 50 years. Result of Seoul could reflect urbanization. Hydrodynamic perturbation disturbs a conductive and steady state thermal regime at the shallow depth.
DISCUSSION 2 Unknown thermal diffusivity sometimes produces a misinterpretation. New data acquisition near the meteoric station to confirm the amplitude of temperature increase is necessary.
CONCLUSIONS 1 Korea is a vacant area for the surface temperature reconstruction from borehole data. The observed temperature data often include the hydrodynamic perturbation. Reconstructed GST series are concordant with the observed GST.
CONCLUSIONS 2 Surface T increases over the last 50 years. The result in Seoul could reflect urbanization effect. To confirm these results, new data acquisition and reconstruction are necessary.