Download
1 / 7
70 likes | 186 Vues
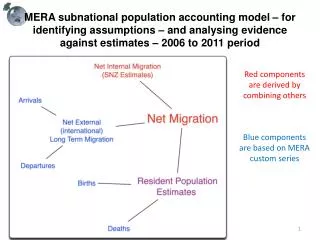
This document presents the MERA Subnational Population Accounting Model, focusing on identifying assumptions and analyzing evidence against estimates from 2006 to 2011. Red components in the model derive from combined sources, while blue components utilize MERA's custom series. Key comparisons include the MERA modeled versus SNZ actual net migration assumptions for 2010-2011, along with changes in the rate of population growth. Additionally, it covers components affecting population changes for Greater Christchurch, particularly the July school rolls by age during the 2010/2011 period.

E N D
MERA subnational population accounting model – for identifying assumptions – and analysing evidence against estimates – 2006 to 2011 period Red components are derived by combining others Blue components are based on MERA custom series
MERA Modelled versus SNZ Actual Net Migration assumptions 2010-2011
MERA Modelled versus SNZ Actual Net Migration assumptions 2010-2011
Components of the change in population for the 2010/2011 June Year