Download
1 / 52
530 likes | 705 Vues
Galaxies in low density environments. Michael Balogh University of Durham. Nature vs. Nurture: galaxy formation and environment. Michael Balogh University of Durham. Outline. Review of cluster galaxy properties Theoretical expectations First clues: clusters at intermediate redshift

E N D
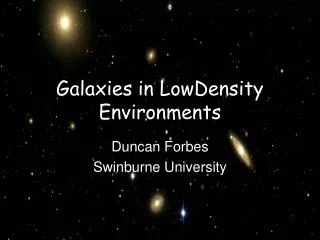
Galaxies in low density environments Michael Balogh University of Durham
Nature vs. Nurture: galaxy formation and environment Michael Balogh University of Durham
Outline • Review of cluster galaxy properties • Theoretical expectations • First clues: clusters at intermediate redshift • New results: tracing star formation in all environments in the local Universe • Future work
Cluster Galaxies: background • Segregation of luminosities, morphologies, and emission line fraction well-known • Early-types consistent with passive evolution since z>2 • Small fraction of actively star-forming galaxies
Nature or Nurture? • Nature? Elliptical galaxies only form in protoclusters at high redshift. Rest of population is due to infall. • or Nurture? Galaxy evolution proceeds along a different path within dense environments.
Butcher-Oemler effect • Concentrated clusters at high redshift have more blue galaxies than concentrated clusters at low redshift Butcher & Oemler (1984)
Butcher-Oemler effect • A lot of scatter • appears to be mostly due to correlation with cluster richness • still room to worry about cluster selection? Margoniner et al. (2001)
Butcher-Oemler effect SDSS: Goto et al. (2003) • Many of blue galaxies turned out to have post-starburst spectra (Dressler & Gunn 1992; Couch & Sharples 1987) • Suggested nurture: • ram-pressure stripping (Gunn & Gott 1972) • tidal effects (Byrd & Valtonen 1990) • harassment? (Moore et al. 1999)
But: Field galaxy evolution • But field population also evolves strongly (Lilly et al. 1996) • Post-starburst galaxies equally abundant in the field (Zabludoff et al. 1996; Goto et al. 2003) • So: does BO effect really point to cluster-specific physics, or just the evolving field and infall rate (Ellingson et al. 2001)? Steidel et al. (1999)
Clusters If it is “nurture”… • Could cosmic SFR evolution be a consequence of environment? • Only if star formation rates are low in groups and low-density environments as well as clusters Groups
Galaxy formation theory Cole et al. (2000), Kauffmann et al. (1999); Somerville et al. (1999) and many others
Feedback Radiative cooling Radiative cooling Feedback Galaxy formation cartoon
Theory 1. Typical galaxy forms stars at decaying rate Rocha-Pinto et al. (2000)
Theory • Typical galaxy forms stars at exponentially decaying rate • Galaxies in dense regions form earlier z=5 z=0 Benson et al. (2002)
Feedback Radiative cooling Radiative cooling Feedback Theory • Typical galaxy forms stars at exponentially decaying rate • Galaxies in dense regions form earlier • “Strangulation”: Galaxies in dense environments lose hot halo Larson et al. (1980)
Theory: predictions • no ram-pressure stripping, harrassment included, yet achieve reasonable match to observed clusters (Diaferio et al. 2001; Okamoto et al. 2003) • isolated galaxies should be at centre of cooling flow, hence forming stars • Galaxies in clusters should be forming stars at a lower rate than those in the field
Observations: z~0.3 CNOC clusters (with Morris, Carlberg, Yee, Ellingson, Schade) AAT spectroscopy (with Couch, Bower)
Observations: z~0.3 • Average SFR varies gradually with radius • low average SFR even beyond virial radius • Gradient much steeper than expected from morphology-density relation Field Morph-density relation CNOC clusters Balogh et al. (1998)
Observations: z~0.3 • Strangulation model: • infall rate + assumed decay rate of star formation => radial gradient in SFR • Radial gradients in CNOC clusters suggest t ~2 Gyr Balogh, Navarro & Morris (2000)
Nod & Shuffle: LDSS++ band-limiting filter + microslit = ~800 galaxies per 7’ field observed 4 clusters at z~0.3
Ha in Rich Clusters at z~0.3 • Number of emission lines galaxies is low in all clusters • However, shape of luminosity function similar to field: • consistent with shift in normalisation; not in Ha luminosity (Field) Couch et al. (2001) Balogh et al. (2002)
Observations: z~0 2dFGRS (with Bower, Lewis, Eke, Couch et al.) SDSS (with Nichol, Miller, Gomez et al.)
Observations: z~0 • Analysis of 2dFGRS • Ha equivalent widths, within 20 Mpc of known clusters • dependence of mean SFR on local density • “critical density”? Lewis, Balogh et al. (2002)
Observations: z~0 R > 2 R200 • Analysis of 2dFGRS • Ha equivalent widths, within 20 Mpc of known clusters • dependence of mean SFR on local density • “critical density”? • independent of distance to cluster Lewis, Balogh et al. (2002)
Observations: z~0 • Analysis of SDSS • same trend observed in SFR from Ha fluxes • same value of “critical density” /yr) Field 75 percentile th o 75 percentile th Star Formation Rate (M Field median Median Distance from Cluster Centre (R/ R ) virial Gomez et al. (2003)
New results: combining the SDSS and 2dFGRS • Combined sample of 24,968 galaxies at 0.05<z<0.1 (Balogh, Eke et al. MNRAS submitted) • Volume limited: Mr<-20.6 (SDSS); Mb<-19.5 • 3 measures of environment: • “traditional” projected distance to 5th nearest neighbour • 3-dimensional density on 1 and 5 Mpc scales • velocity dispersion of embedding cluster or group • catalogues of Nichol, Miller et al. and Eke et al.
Bimodality • SDSS colours show two distinct populations • Red population may be the result of major mergers at high redshift, followed by passive evolution (u-r)0 Baldry et al. (2003)
Bimodality • Same is seen in Ha distribution: SFR is not continuous • galaxies do not have arbitrarily low SFR • So mean/median do not necessarily trace a change in SFR
The star-forming population • Amongst the star-forming population, there is no trend in mean SFR with density! • Same is seen in z~0.5 cluster Ha luminosity functions • Rules out slow-decay models
Correlation with density • The fraction of star-forming galaxies varies strongly with density • Correlation at all densities; still a flattening near the critical value 2dFGRS
Isolated Galaxies • Selection of isolated galaxies: • non-group members, with low densities on 1 and 5.5 Mpc scales • ~30% of isolated galaxies show negligible SF • challenge for models? • environment must not be only driver of evolution. All galaxies Bright galaxies
Isolated Galaxies • Fraction of SF galaxies in lowest density environments is not much larger than the average • So strong evolution in global average cannot be due only to a change in densities Average value in full sample
Large scale structure • Some dependence on cluster velocity dispersion? • More obvious in 2dF catalogue than in SDSS 2dFGRS 200<s<400 km/s s>500 km/s
0.050 r5.5 (Mpc-3) 0.010 0.005 Large scale structure • Emission-line fraction appears to depend on 1 Mpc scales and on 5.5 Mpc scales. Increasing fraction of Ha emitters
Nature vs. Nurture • Nurture: clusters directly affect SFR? • rule out long-timescale processes (strangulation) • trends at low densities and large scales rule out ram-pressure stripping as dominant effect z~0.3 z~0.1
Nature vs. Nurture Blue galaxies only: (g-r)<0.7 • Nurture: clusters directly affect SFR? • short timescale? • few (<0.1 %) E+As • normal SFR for colour • however, these don’t provide strong constraints: it is possible to generate entire non-SF population in this way
Nature vs. Nurture Passive spirals in SDSS • Nurture: clusters directly affect SFR? • short timescale? • morphology is longer lived • maybe passive spirals are more common in clusters (Goto et al. 2003; also Poggianti et al. 1999; Balogh et al. 2002; McIntosh et al. 2002) Goto et al. (2003)
Nature vs. Nurture • Nature: • Dense regions just form a little earlier? • would expect to see lower SFR among active population in high-z clusters: not observed • Early-type population formed at high redshift? • would have to be a substantial fraction of today’s cluster population: so why does the fraction of SF galaxies evolve? (or does it?)
Most likely scenario (for bright galaxies)? • Probably several effects: brightest ellipticals likely result of initial conditions • Galaxy-galaxy interactions: • more common in dense regions • change SFR on short timescale • effective in small groups • evolve strongly with redshift • only environment known to effectively transform SFR of a galaxy (e.g. Lambas et al. 2002)
Future Work Groups at z~0.5 (Dave Wilman, R. Bower, J. Mulchaey, A. Oemler, R. Carlberg et al.)
Groups at z~0.5 • Based on the CNOC2 redshift survey. Group selection and inital look at properties described in Carlberg et al. (2001) • Follow-up observations with Magellan to gain higher completeness and depth • HST data for all groups • Also infrared data from WHT
The Future: Groups at z~0.5 • Deep Magellan spectroscopy and HST imaging of ~30 groups at z~0.5 • trace SFR with [OII] ) Å 0 5 10 15 20 25 30 Mean EW [OII] ( 0 0.3 0.6 0.9 1.2 1.5 Distance from centre ( Mpc ) Wilman et al. in prep
Groups at z~0.5 • Preliminary results suggest SFR distribution in z~0.5 groups is different from that in clusters: enhanced SFR due to interactions?
Conclusions • Distribution of star formation rates is bimodal, not continuous (unlike morphology?) • SFR distribution among active population is independent of environment • Fraction of SF galaxies depends on local and large-scale densities (?) • Galaxy-galaxy interactions are the most likely cause of observed segregation
Projection Effects? • Is star-forming population all projected?? • No: at high density, contrast is high, and area is small • at low density, trend is weak, so signal not diluted by projection projected population at field density projected population 10 times more dense than field True/observed emission line fraction Balogh et al. (2003)
Theory: SF in clusters and field • Age effect only? Star formation rate Time
Theory: SF in clusters and field cluster • Age effect only? • Then SFR in clusters should be lower at any epoch Star formation rate Time
Theory: SF in clusters and field • Strangulation? • SF decays more quickly in clusters, so should still be lower cluster Star formation rate Time
Theory: SF in clusters and field • Truncation? • Then star-forming galaxies should all look the same cluster Star formation rate Time
Abell 2390 (z~0.23) 3.6 arcmin R image from CNOC survey (Yee et al. 1996)