Download
1 / 40
470 likes | 948 Vues
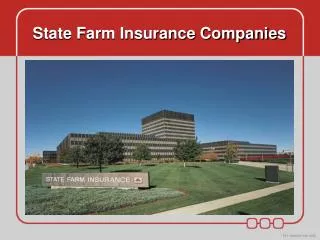
State Farm Insurance Companies. Agenda. State Farm Overview State Farm Investment Department State Farm Fixed Income. State Farm Overview. Company Evolution. George J. Mecherle. Auto Health. Life Fire. SF Bank & Mutual Funds. “About State Farm”.

E N D
Agenda • State Farm Overview • State Farm Investment Department • State Farm Fixed Income
Company Evolution George J. Mecherle Auto Health Life Fire SF Bank & Mutual Funds
“About State Farm” • State Farm’s mission is to: • help people manage the risks of everyday life, • recover from the unexpected, • and realize their dreams.
State Farm Data • 23 Affiliated Companies • 16,900 Agents • 68,000 Employees • 76.2 Million Policies & Accounts • $ 59.2 Billion Revenue (12/31/05) • $159.7 Billion in Assets (12/31/05) • $ 50.2 Billion Net Worth (12/31/05) • Ranked #22 within Fortune 500 • Ranked #1 in Illinois
Industry Positions • #1 U.S. Auto insurer since 1942 • 17.7% Market Share at end of 2005 • Over 40 million Auto policies • #1 U.S. Home insurer since 1964 • 22.2% Market Share at end of 2005 • Over 25 million Fire policies • SF Bank • $12.2 billion in total assets (12/2005) • Top 5% of banks nationwide • Mutual Funds • $2.8 billion in assets (12/2005)
Investment Department Invested Assets* ($ Billions) * (12/31/2006)
Why does State Farm have an Investment Department? • Amount of “float” the business generates • Premiums • Reserves • Cost of the float • Claims • Operating expenses • Long-term outlook for both these factors • Write more policies
Property/Casualty Company Change in Adjusted Surplus Example: XYZ Property Casualty Company (5-year period) Underwriting Losses including Policyholders’ Dividends (25.0) % Stock Portfolio Appreciation 30.0 % Net Investment Income 55.0 % Other (3.0) % Net Increase to Surplus 57.0 %
Structure Investment Policy to Withstand Worse Case Scenario • Major underwriting losses • Discovery of gross underestimation of cost of unpaid claims • Collapse in stock and long-term bond prices
Insurance Company Financial Adequacy Ratios • Premiums / surplus – tests adequacy of capital to prolonged poor underwriting results • Loss reserves / surplus – tests potential for estimation error relative to capital • Equities / surplus – tests potential for stock market declines to reduce capital
State Farm’s Top 10 Catastrophe Pay-outs (Auto & Fire Combined)
Investment Department Goals • Support insurance & financial service operations • Invest long-term
Support Insurance and Financial Service Operations • State Farm Companies are first and foremost insurance companies with growing financial service operations • Make investment decisions for investment reasons first
Long Term Investing Long-term investors have earned higher returns over the years from equity investments versus any other asset class Equities: Goal: Maximize shareholder value Return: Potentially unlimited Fixed Income: Goal: Capital preservation Return: Generally limited to coupon or yield
Risk vs. Return, 1926 – 2005 (nominal returns) Data Source: Stocks, Bonds, Bills and Inflation 2006 Yearbook, Ibbotson Associates, Inc., Chicago, Illinois
Global Major Marketsmarket value of invested assets Stocks Bonds Corporate Bonds $ 6.7 trillion
U.S. Major Marketsmarket value of invested assets Stocks, U.S. Bonds, U.S. Corporate Bonds $ 3.1 trillion
Major Market Indices Lehman Aggregate Index bonds S&P 500 Index stocks • 994 issuers • 7,158 issues • $ 8.8 trillion par outstanding • Asset Classes • U.S. Government (35.7%) • Treasury bonds • Agencies • Corporate Bonds (23.1%) • Mortgage-Backed (35.1%) • Asset-Backed (1.2%) • Commercial Mortgage-Backed (5.0%) • Taxable Municipals (new as of Oct. 1, 2003) • $ 13.1 trillion market value • Capitalization-weighted Index
Bonds* – 12/31/2006 * Insurance Company Portfolios
State Farm Investment Philosophies and Disciplines: • Buy and Hold • Dollar-Cost Average • Portfolio Ladder • Duration Target
Corporate Bonds • Private vs. Public • Analyzing and investing in corporate bonds • Pricing corporate bonds
Fundamental Credit Analysis • Industry Analysis – Porter’s 5 Forces • Business Risk Analysis • Financial Risk Analysis
Porter’s Five Forces of Competition • Barriers to Entry • Threat of Substitute Products • Power of Suppliers • Power of Buyers • Rivalry among Existing Competitors Source: Michael Porter, Competitive Strategy
Business Risk Analysis • Industry Characteristics • Competitive Position • Management
Financial Risk Analysis • Financial Characteristics • Financial Policy • Profitability • Capital Structure • Cash Flow Protection • Financial Flexibility
Common Financial Ratios • EBIT / Interest – tests the adequacy of operations to meet interest payments • CA / CL – tests liquidity • Debt / Cap – tests leverage (loan to value) • Funds from Operations / Debt – tests cash flow adequacy to repay debt
Corporate Bond Pricing { Idiosyncratic Risk Credit Spread Systematic Credit Risk { = Yield Yield Curve Risk-Free Rate T-Bill
Why can’t I find a quote for Duke Energy bonds – • herein lies the answer:
Example of 10-Year AT&T bond yield: { Idiosyncratic Risk 1.70 % 0.70 % 3.00 % 2.00 % 10-year Credit Spread { Systematic Credit Risk * 2.40 % 7.40% = Yield Yield Curve 10-yr Risk-Free Rate 5.00 % T-Bill * Swap Spreads or Agencies
Example of 10-Year AT&T bond prices: • 6% coupon 10-year AT&T corporate bond trading at a yield of 7.4% = $90.23 (discount) • 8% coupon 10-year AT&T corporate bond trading at a yield of 7.4% = $104.19 (premium) The coupons are different but both bonds trade at the same yield, 7.4%.
Example of 10-Year AT&T bond bid/ask yields: Bid (yield at which you can sell) Assume 10-Year Treasury is 5.00% 2.45% Yield on Bid Side 7.45% Remember from finance class – bond prices and yields are inversely related – a lower yield means a higher price. Think of bid/ask spread for stocks. You have to buy at a higher price than you can sell. The same holds true for bonds. Offer (yield at which you can buy) Assume 10-Year Treasury is 5.00% 2.40% Yield on Offer Side 7.40%
Investing in a New Public Corporate Bond Issue Perform fundamental credit analysis Road shows, Conference calls, Red-herring prospectus New deal is announced Determine relative value Submit order Price guidance Receive allocation and final spread Deal goes “subject” Price the deal, bill & deliver
Contact Information State Farm Insurance Human Resources Three State Farm Plaza South, K-1 Bloomington, IL 61791 Need more information? Visit our website! www.statefarm.com E-mail: jobopps.corpsouth@statefarm.com