
ETA / NOAH LAND-SURFACE MODEL UPGRADES : 24 Jul 01
ETA / NOAH LAND-SURFACE MODEL UPGRADES : 24 Jul 01. - assimilation of hourly precipitation -- hourly 4-km radar/gage analysis (Stage IV)

ETA / NOAH LAND-SURFACE MODEL UPGRADES : 24 Jul 01
E N D
Presentation Transcript
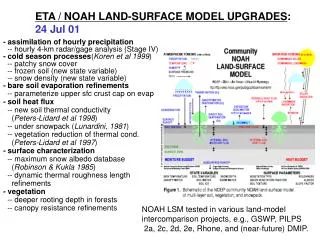
ETA / NOAH LAND-SURFACE MODEL UPGRADES: 24 Jul 01 - assimilation of hourly precipitation -- hourly 4-km radar/gage analysis (Stage IV) - cold season processes(Koren et al 1999) -- patchy snow cover -- frozen soil (new state variable) -- snow density (new state variable) - bare soil evaporation refinements -- parameterize upper sfc crust cap on evap - soil heat flux -- new soil thermal conductivity (Peters-Lidard et al 1998) -- under snowpack (Lunardini, 1981) -- vegetation reduction of thermal cond. (Peters-Lidard et al 1997) - surface characterization-- maximum snow albedo database (Robinson & Kukla 1985) -- dynamic thermal roughness length refinements - vegetation -- deeper rooting depth in forests -- canopy resistance refinements NOAH LSM tested in various land-model intercomparison projects, e.g., GSWP, PILPS 2a, 2c, 2d, 2e, Rhone, and (near-future) DMIP.
Fixed Fields Land mask (land=1; sea=0) Vegetation type [index, 1-13] Soil type [index, 1-9] Surface slope type [index] Snow-free albedo [%] Maximum snow albedo [%] Surface roughness [m] Soil column bottom temp. [K] Number of root zone soil layers [non-dim]
LAND-SURFACE RELATED OUTPUT FIELDS LAND-SURFACE STATES: Surface skin temperature [K] Plant canopy surface water [kg/m^2] Accum. Snow [kg/m^2] Snow depth [m] Soil layers (0-10, 10-40, 40-100, 100-200cm): Volumetric soil moisture (frozen + liquid) [frac.] Liquid volumetric soil moisture (non-frozen) [frac.] Soil temp. [K] OTHER MODEL OUTPUT: Surface: Surface potential temperature [K] Precipitation rate [kg/m^2/s] Total precipitation [kg/m^2] Total precipitation (nearest grid point) [kg/m^2] Convective precipitation [kg/m^2]
LAND-SURFACE RELATED OUTPUT FIELDS OTHER MODEL OUTPUT (cont’d): Surface (cont’d): Evaporation [kg/m^2] Potential evaporation [kg/m^2] Surface runoff (non-infiltrating) [kg/m^2] Subsurface runoff (baseflow) [kg/m^2] Snow melt [kg/m^2] Snow cover [%] OTHER MODEL OUTPUT (cont’d): Surface (cont’d): Green vegetation cover [%] Canopy conductance [m/s] Solar parameter in canopy conductance [fraction] Temperature parameter in canopy conductance [frac.] Humidity parameter in canopy conductance [fraction] Soil moisture parameter in canopy conductance
LAND-SURFACE RELATED OUTPUT FIELDS OTHER MODEL OUTPUT (cont’d): Surface (cont’d): Downward shortwave radiation flux [W/m^2] Downward longwave radiation flux [W/m^2] Upward short wave radiation flux [W/m^2] Upward long wave radiation flux [W/m^2] Albedo [%] Aerodynamic conductance [m/s] Surface friction velocity [m/s] Surface drag coefficient [non-dim] Zonal momentum flux [N/m^2] Meridional momentum flux [N/m^2] OTHER MODEL OUTPUT (cont’d): Soil: Bottom soil temp. [800 cm, K] Moisture availability [0-100 cm,%] Soil moisture content [0-200 cm, kg/m^2] 2 meter: Temp. [K] Specific humidity [kg/kg] Dew point temp. [K] Relative humidity [%] Pressure [Pa]
LAND-SURFACE RELATED OUTPUT FIELDS OTHER MODEL OUTPUT (cont’d): 10 and 30 meter: u wind [m/s] v wind [m/s] Potential temp. [K] Temp. [K] Specific humidity [kg/kg] Pressure [Pa] Planetary boundary layer height [m]
SAMPLE LAND-SURFACE RELATED MODEL OUTPUT Surface skin temperature [K] DROUGHT YEAR (1988): 15 July, 21Z FLOOD YEAR (1993): 15 July, 21Z
SAMPLE LAND-SURFACE RELATED MODEL OUTPUT 10-40cm soil moisture [soil layer 2, volumetric] DROUGHT YEAR (1988): 15 July, 21Z FLOOD YEAR (1993): 15 July, 21Z
SAMPLE LAND-SURFACE RELATED MODEL OUTPUT 0-100cm soil moisture availability [fraction] DROUGHT YEAR (1988): 15 July, 21Z FLOOD YEAR (1993): 15 July, 21Z
SAMPLE LAND-SURFACE RELATED MODEL OUTPUT Sensible heat flux [W/m^2] DROUGHT YEAR (1988): 15 July, 21Z FLOOD YEAR (1993): 15 July, 21Z
SAMPLE LAND-SURFACE RELATED MODEL OUTPUT Latent heat flux [W/m^2] DROUGHT YEAR (1988): 15 July, 21Z FLOOD YEAR (1993): 15 July, 21Z
SAMPLE LAND-SURFACE RELATED MODEL OUTPUT Boundary layer depth [m] DROUGHT YEAR (1988): 15 July, 21Z FLOOD YEAR (1993): 15 July, 21Z
COLD SEASON (01 Jan 1992, 21Z) First soil layer (left): frozen soil moisture (volumetric), and 0C isotherm. Snow cover (fraction, left) and snow depth (cm, right). Daily update of assimilated snow (depth) must be included in moisture budget.
PRECIPITATION (July 1993-1988) Drought of 1988 vs Flood of 1993 Difference of observed monthly total precipitation from gauge-only analysis (Higgins and Shi, Schaake personal comm.) Difference of monthly total precipitation produced by Regional Reanalysis with its precipitation assimilation
GREEN VEGETATION FRACTION From global, monthly 0.144 degree green vegetation fraction database (Gutman and Ignatov, 1998). Values are assumed valid on the 15th of each month, and interpolated to each day of the year for model input.