Boxplots
Boxplots. Boxplots and 5-Number Summaries. To draw a boxplot, first we find the 5-Number Summary of our data. 87,94,99,86,87,80,79,77 Re-Ordered: 77,79,80,86,87,87,95,99 Next, find the 5 numbers that summarize our data: Median, Q1, Q3, Min, Max. Boxplots. 77, 79, 80, 86, 87, 87, 94, 99


Boxplots
E N D
Presentation Transcript
Boxplots and 5-Number Summaries • To draw a boxplot, first we find the 5-Number Summary of our data • 87,94,99,86,87,80,79,77 • Re-Ordered: • 77,79,80,86,87,87,95,99 • Next, find the 5 numbers that summarize our data: Median, Q1, Q3, Min, Max
Boxplots • 77, 79, 80, 86, 87, 87, 94, 99 • Median: 5 • Divide the list into two halves:77, 79, 80, 86 and 87, 87, 94, 99 • Q1 = • Q3= • Minimum: 77 • Maximum: 99
5-Number Summary for Boxplot • Max: 99 • Q3: 90.5 • Median: 86.5 • Q1: 79.5 • Min: 77
Creating Your Boxplot • Draw a single vertical or horizontal line that spans the entire data set. • Draw short horizontal lines at the lower and upper quartiles and at the median • Connect these lines to form a box • Place “fences” at 1.5IQRs above the upper quartile and 1.5IQRs below the lower quartile. • Upper Fence: Q3+1.5IQR • Lower Fence: Q1-1.5IQR
Drawing Your Boxplot • These “fences” are not part of the final boxplot, they are there to aid in its construction. • The next step is to draw the “whiskers” that extend up to the largest and smallest data point within the fences. • Do not draw the line to outliers beyond those fences!
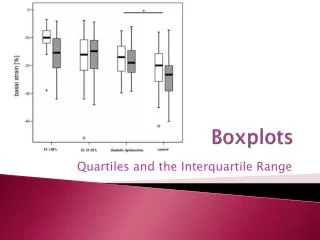
Significance of a Boxplot • The center of a boxplot is a box that shows the middle half of the data, between the quartiles • The height of the box is equal to the IQR • If the median is roughly centered between the quartiles, then the middle half of the data is roughly symmetric • If the median is not centered, the distribution is skewed. Whiskers show skewness as well if they are not roughly the same length • Outliers are displayed as individuals
Homework Read Chapter 5 Pg 95, # 5 – 8 Pg99, #23, 26 And! Review Sheet -- start looking it over. Review tomorrow! Read Chapter 4 Pg 73, #15, 17, 19, 47