Piecewise & Step Functions: Graphing & Interpretation
Learn to graph and interpret piecewise-defined and step functions, identify key features, and understand domain and range. Practice modeling relationships between quantities and exploring absolute value functions.

Piecewise & Step Functions: Graphing & Interpretation
E N D
Presentation Transcript
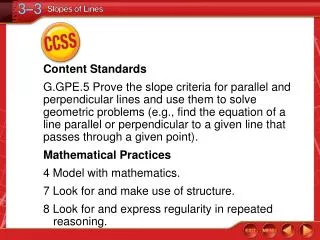
Content Standards F.IF.4 For a function that models a relationship between two quantities, interpret key features of graphs and tables in terms of the quantities, and sketch graphs showing key features given a verbal description of the relationship. F.IF.7.b Graph square root, cube root, and piecewise-defined functions, including step functions and absolute value functions. Mathematical Practices 1 Make sense of problems and persevere in solving them. CCSS
You modeled data using lines of regression. • Write and graph piecewise-defined functions. • Write and graph step and absolute value functions. Then/Now
piecewise-defined function • piecewise-linear function • step function • greatest integer function • absolute value function Vocabulary
Piecewise-Defined Function Step 1Graph the linear function f(x)= x – 1 for x ≤3. Since 3 satisfies this inequality, begin with a closed circle at (3, 2). Example 1
Piecewise-Defined Function Step 2Graph the constantfunction f(x)= –1 forx > 3. Since x doesnot satisfy thisinequality, begin withan open circle at(3, –1) and draw ahorizontal ray to theright. Example 1
Piecewise-Defined Function Answer: Example 1
Piecewise-Defined Function Answer: The function is defined for all values of x, so the domain is all realnumbers. The values that arey-coordinates of points on thegraph are all real numbersless than or equal to 2, so therange is {f(x)| f(x)≤ 2}. Example 1
A.domain: all real numbersrange: all real numbers B.domain: all real numbersrange: {y|y > –1} C.domain: all real numbersrange: {y|y > –1 or y = –3} D.domain: {x|x > –1 or x = –3}range: all real numbers Example 1
A.domain: all real numbersrange: all real numbers B.domain: all real numbersrange: {y|y > –1} C.domain: all real numbersrange: {y|y > –1 or y = –3} D.domain: {x|x > –1 or x = –3}range: all real numbers Example 1
A. B. C. D. Identify the piecewise-defined function shown in the graph. Example 2
A. B. C. D. Identify the piecewise-defined function shown in the graph. Example 2
Use a Step Function PSYCHOLOGY One psychologist charges for counseling sessions at the rate of $85 per hour or any fraction thereof. Draw a graph that represents this situation. Understand The total charge must be a multiple of $85, so the graph will be the graph of a step function. Plan If the session is greater than 0 hours, but less than or equal to 1 hour, the cost is $85. If the time is greater than 1 hour, but less than or equal to 2 hours, then the cost is $170, and so on. Example 3
Use a Step Function Solve Use the pattern of times and costs to make a table, where x is the number of hours of the session and C(x) is the total cost. Then draw the graph. Example 3
Use a Step Function Answer: Example 3
Use a Step Function Answer: Check Since the psychologist rounds any fraction of an hour up to the next whole number, each segment on the graph has a circle at the left endpoint and a dot at the right endpoint. Example 3
Absolute Value Functions Graph y = |x| + 1. Identify the domain and range. Create a table of values. Example 4
Absolute Value Functions Graph the points and connect them. Answer: The domain is all realnumbers. The range is {y | y ≥ 1}. Example 4
Identify the function shown by the graph. A.y = |x| – 1 B.y = |x – 1| – 1 C.y = |x – 1| D.y = |x + 1| – 1 Example 4
Identify the function shown by the graph. A.y = |x| – 1 B.y = |x – 1| – 1 C.y = |x – 1| D.y = |x + 1| – 1 Example 4