Penning Transfers in Gas Detectors: Enhancing Energy Resolution
410 likes | 449 Vues
Study on Penning transfers in gas mixtures for improved energy resolution in gas detectors using theoretical calculations and experimental data analysis. Gas amplification and transfer probabilities are evaluated for noble gas and molecular gas mixtures. Method involves simulation with Magboltz program and fitting experimental data for Penning transfer probabilities.

Penning Transfers in Gas Detectors: Enhancing Energy Resolution
E N D
Presentation Transcript
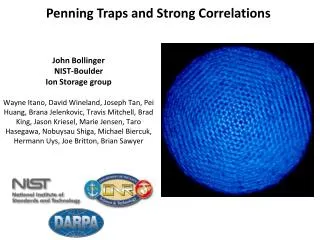
PENNING TRANSFERS Ozkan SAHIN Uludag University Physics Department Bursa -Turkey 2nd RD51 Collaboration Meeting Paris, 13-15 October 2008
Outline Introduction Calculation Methods Calculated Results Discussions
Introduction Gas detectors are filled with pure noble gases and gas mixtures. Because of its high specific ionization and low cost, argon is usually preferred as noble gas. However, pure argon gas can not be operated because of the high excitation energy levels. Photons emitted by excited argon atoms can reach the cathode wall and can produce a low energy electron at the cathode surface through the photoelectric effect. This single electron will then drifts toward the anode and create another signal pulse. Since noble gases have low absorption cross sections for these photons, they are not stopped by argon gas itself. This problem can be remedied by the addition of quencher gasses. These admixtures absorb the radiated photons and dissipating this energy through dissociation, elastic or inelastic collisions.
Introduction In gas mixtures, Penning transfers occur if the metastable excitation energy level of one gas component is energetically higher compared to the ionization energy of the other gas component. Thus, it is possible to transfer energy stored in excited metastable state of one gas to ionization of the other. Penning gas mixtures consist of a rare gas (Ne, Ar …) and an admixture, usually a molecular gas, which is present in a relatively low concentration. It is expected that Penning mixtures improve the detector energy resolution because of lower W and F values. As a result of the Penning transfer, the number of electron- ion pairs produced in the mixture increases, thus lowering the mean energy required to form an ion pair, and the Fano factor.
Introduction Gas amplification is a consequence of the motion of a free electron in a strong electric-field. By increasing the field in the gas volume (above a few kV/cm) electrons can gain enough energy between two collisions to produce ionization. After such an ionizing collision, an electron-ion pair is produced and the primary electron continues its trajectory. Electrons from ionized atoms are also accelerated and can knock out more electrons which in turn ionize other atoms. Due to the Penning transfers, the number of the generated electron-ion pairs by a free electron per unit length and the gas amplification factor can also be increased in gas mixturesfor a fixed field strength.
Introduction In a cylindrical proportional counter the mean gas amplification factor (gas gain) can be given by: where, ra is the anode radius and rbcan be determined as the distance from the center of the anode wire where (E(r)) is zero. The first Townsend ionization coefficient () represents the mean number of ion pairs created by a free electron per unit length in an electric field. This parameter depends on the nature of the gas, its pressure, its temperature and the applied electric field. The electric field strength E(r) at the radius r in the counter can be computed in terms of the anode radius ra, the cathode radius rc and the anode potential Vas:
Calculation Methods The Magboltz program has been usedto reproduce the experimental gas gain curves. It performs a Monte Carlo simulation to compute transport properties of the gas for electrons with varying electric field strengths in the given range. Electric field range and the gas properties such as pressure, temperature and the fractions of the gas type in the mixture are entered to the Magboltz. The output file contains all needed transport properties like drift velocities, longitudinal and transverse diffusioncoefficients, attachment coefficients, and Townsend coefficients(E(r)) of electrons. Detailed collision frequencies ofexcitations and ionisations in the gas mixtures can also be derived from the output file. The Townsend coefficients were used to find the corrected Townsend coefficients for estimating the Penning effect from experimental data.
Calculation Methods The Penning tranfer probabilty PT is the fraction of the energy in the excited states that will cause further ionizations by the Penning process. Since we do not a priori know the transfer probabilities, we have developed a tool to derive them from published experimental. To find PT, we fit the experimental gain data using Townsend coefficients updated for all energetically allowed Penning transfers:
Calculation Methods Certain excited states of the gas atoms or molecules have enough energy to ionize the other ones tocontribute the Penning process. Hence, one should pay attention to the selection of possible Penning transfers before the calculations. Magboltz knows the energy levels of the excited states and the ionization potentials of each gas in the mixture. A fitting procedure has been addedinto the our simulation program. This subroutine iterates using a least squares method to find the transfer probabilities PT(i). It returns the errors on the fit paremeters and the covariance matrix. Given the low sensitivity to some PT(i) and the correlations between the PT(i), the parameters were varied collectively.
Experimental Calculation without Penning transfers Calculation Methods Fig.1 shows the Townsend coefficients without Penning transfers for argon 97.8% - isobutane 2.2% gas mixture, at 90 kPa and 300 0K. The experimental gas gain data and the calculated results without corrected Townsend coefficients are given in Fig.2. Fig.1 Townsend coefficients (without Penning transfers). Fig.2 Experimental and calculated gas gains.
Calculation Methods As can be seen from the semi-log plot of the gas gain, the experimental data display an over-exponential growth at high potentials. This can be explained by secondary avalanches due to insufficient quenching of UV photons emitted by excited rare gas atoms. Such an effect is seen mostly in mixtures containing low quencher gas concentrations. If G is the mean gain without feedback, then the gain Gtot includingphoton feedback can be written as:
Calculation Methods Pγis the probability that an ionisation in the primary avalanche produces a photon which leads to a secondary avalanche. We call Pγthe photon feedback term (shortly photon term) and include it in our fits. Example: argon-isobutane mixtures. The ionization potential of isobutane (I=10.7 eV) is lower than the excitation energy of the argon metastable levels (S-level 11.55 eV, P-level 13.0 eV, D-level 14 eV). In addition, the energy in the third level excitation of isobutane (17.0 eV) is higher than the ionization potential of argon (15.7 eV). Hence, all these excited states should be taken into account for Penning transfers.
Argon ionisation Argon P level exc. Argon S level exc. Isobutane ionisation Argon D level exc. Isobutane level exc. Calculation Methods Fig.3 Frequencies of excitations and ionisations versus electric field.
Calculation with Penning transfers Calculation with Penning transfers Measured gains Calculation without Penning transfers Calculation without Penning transfers Calculation Methods The corrected Townsend coefficients have been calculated after including all possible Penning transfers and considering the photon feedback term (Fig. 4). A good agreement is obtained (Fig. 5). Fig.4 Corrected and uncorrected Townsend coefficients. Fig.5 Measured and calculated gas gains.
Calculated Results 7 different argon-based gas mixtures have been investigated 1 Argon – Ethane 2 Argon – Isobutane 3 Argon – Propane 4 Argon – Methane 5 Argon – Acetylene 6 Argon – CO2 7 Argon – Xenon
Possible Penning Tranfers: Ar* (S, P, D level exc.) C2H6 C2H6* (Exc.3) Ar Calculated Results Argon Energy Diagram for Argon – Ethane mixtures S-Level P-Level D-Level Ion. Exc.1 Exc.2 Exc.3 8.2 10.3 11.5513.0 14.0 15.717.0eV ion. 11.42 Penning transfers ~13.6% photon term = 0.243E-04
Argon Energy Diagram for Argon – Isobutane mixtures S-Level P-Level D-Level Ion. Exc.1Exc.2 ionExc.3 Possible Penning Tranfers: Ar* (S, P, D level exc.) iC4H10 iC4H10* (Exc.3) Ar 7.49.7 10.6711.55 13.0 14.0 15.717.0eV Calculated Results Penning transfers ~18.2% photon term = 0.243E-04
Argon Energy Diagram for Argon – Propanemixtures S-Level P-Level D-Level Ion. Exc.1 Exc.2 ion Exc.3 Possible Penning Tranfers: Ar* (S, P, D level exc.) C3H8 C3H8* (Exc.3) Ar 7.7 10.011.55 13.0 14.0 15.717.0eV 11.42 Calculated Results Ar + 1%, 2%, 5%, %10 Propane
Calculated Results Penning transfers ~20.2% photon term = 0.113E-02 Penning transfers ~21.2% photon term = 0.353E-03 Penning transfers ~21.8% photon term = 0.74E-04
Calculated Results Penning transfers ~17.6% photon term = 0.25E-04
Possible Penning Tranfers: Ar* (P, D level exc.) CH4 Calculated Results Argon Energy Diagram for Argon – Methane mixtures S-Level P-Level D-Level Ion. Dis. exc.Dis.exc Dis.exc. 9.0 10.0 11.011.5513.0 14.0 15.7eV Dis.exc11.42 Ar + 2%, 5%, 10% Methane
Calculated Results Penning transfers ~0.64% photon term = 0.11E-03 Penning transfers ~3.27% photon term = 0.44E-04 Penning transfers ~5.53% photon term = 0.74E-04
Possible Penning Tranfers: Ar* (S, P, D level exc.) C2H2 Calculated Results Argon Energy Diagram for Argon – Acetylenemixtures S-Level P-Level D-Level Ion. Exc.1 Exc.2 Exc.3 1.95 4.90 7.9011.5513.0 14.0 15.7eV ion 11.42 Ar + 0.5%, 2%, 5%, 10% Acetylene
Calculated Results Penning transfers ~47.8% photon term = 0.46E-03 Penning transfers ~45.0% photon term = 0.11E-01 Penning transfers ~46.4% photon term = 0.26E-02
Calculated Results Penning transfers ~48.2% photon term = 0.25E-03
Argon Energy Diagram for Argon – CO2mixtures S-Level P-Level D-Level Ion. Exc.1Exc.2Exc.3 Exc.4 ion Exc.6 Possible Penning Tranfers: Ar* (only D level exc.) CO2 7.9 8.910.511.55 13.0 14.0 15.7eV 12.2 Exc.5 13.2 13.773 15.0 Calculated Results Ar + 5%, 10%, 15%, 20% CO2
Calculated Results Penning transfers ~83.2% Penning transfers ~97.5% Penning transfers ~52.3%
Calculated Results Penning transfers ~88.7%
Argon Energy Diagram for Argon – Xenon mixtures S-Level P-Level D-Level Ion. Exc.1 Exc.3 ion. Possible Penning Tranfers: Ar* (P, D level exc.) Xe 8.31511.5513.0 14.0 15.7eV Exc.2 9.447 9.917 Exc.411.7 12.13 Calculated Results Ar + 0.5%, 2%, 5%, 10% Xenon
Calculated Results Penning transfers ~39.1% photon term = 0.58E-03 Penning transfers ~51.6% photon term = 0.62E-03 Penning transfers ~29.4% photon term = 0.96E-03
Calculated Results Penning transfers ~45.9% photon term = 0.34E-03 Penning transfers ~30.5% photon term = 0.15E-03
(1) Discussions At low admixture concentrations, Penning transfer probabilitiesincrease with increasing percentage of the admixture. When the concentration of the admixturegas is higher, then there are more recipient gas atoms or molecules to receive theenergy stored in the argon metastable states. Therefore, the transfer probabilitiesincrease with quencherfraction up to the point where each excited argon atom finds a quenching gas atom or molecule, if it doesn’t decay before. If we assume that the transfer probability is proportional to the chance that an excited atom(or molecule) meets a recipient before it decays spontaneously in the tdecaytimethen one expects:
(3) (2) Discussions where tmeet is the time needed to meet a recipient atom or molecule. When tcollis the time between gas collisions and fractionis theconcentration fraction of the quencing gas, in this case, tmeet should contain them like: Substitutingequation (1), the Penning transfer probability is given by, On theother hand, the transfer probabilitiesparticularly for Argon-Xenon and Argon-Propane gas mixturesdecrease at high concentrationfraction.This situationindicates that, there would be inelastic collisions between excited argon atoms and the recipient atoms or molecules. This leads to decrease transfer probabilities at higher percentage of quencher.
Discussions If pressure of the gas mixture increases then the mean free path and thus the time between collisions decreases. Therefore, it can be seen from equation (3) that as the collision time decreases (by increasing pressure), the Penning transfer probabilities increase.
Discussions Transfer probabilities for Ar 90% + admixture 10% The magnitudes of the transfer probabilities differ between the admixtures, even for the same concentrarions. If the difference between the metastable states of the argon atom and the ionization potential of the admixture gas is small, the Penning transfer probability is higher. This reflects that some of the metastable states energy of argon can be swallowed from low-energy inelastic states of the admixtures. So, the reason for differences of the Penning transfer probabilities could be differences of the low-energy inelastic states of the admixtures.