Scientific Methods
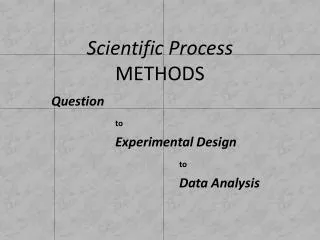
Scientific Methods. The Scientific Method. The scientific method comes in many different forms but always has these basic steps: Ask a question Develop a hypothesis (An if/then statement describing what you think will answer the question) Design an experiment


Scientific Methods
E N D
Presentation Transcript
The Scientific Method • The scientific method comes in many different forms but always has these basic steps: • Ask a question • Develop a hypothesis(An if/then statement describing what you think will answer the question) • Design an experiment • Analyze data and draw conclusions
The Scientific Method Let’s do a real world example: Timmy is a geek and is having a hard time making friends… He just wants to be friends with the cool kids…
The Scientific Method • So Timmy decided to use the scientific method: • First he asks his question:“How can I be a cool kid?” • Then he develops a hypothesis – an if/then statement that should answer his question or solve his problem.“If I take showers every day, then I can be friends with the cool kids!” • He designs an experiment:“I’ll take a shower every day and record how many words the cool kids say to me each day.” • He performs his experiment for a certain amount of time and records all his data.
The Scientific Method • So Timmy decided to use the scientific method: • He analyzes his data and draws conclusions: • He made a graph to display his results: • There is a direct relationship between how many days he showers and how much the cool kids talk to him!
The Scientific Method • Now he can draw a conclusion based on his data: • Timmy concluded that he is now cool and is friends with the other cool kids!
Experimental Variables • In any experiment, it is important to identify the variables that are being affected or kept the same. There are three types: • The Independent Variable • This is the what you change to see what will happen. • Example: For Timmy this was how many days in a row he took a shower. • The Dependent Variable • This is what you hope is affected by the Independent Variable. • Example: How many words a day the cool kids say to Timmy. • Constants • This is everything that was not a part of the experiment but needed to be kept constant. • Example: even though Timmy showered, he still never put on deodorant or stopped playing video games for 12 hours a day. Those variables were held constant.
Graphs Remember: This should all be a REVIEW!
Graph Basics Graphs have 2 axes: the horizontal (usually called ‘x’) and the vertical (usually called ‘y’) Graphs will be named according to what is plotted (it goes by the general form “Y” vs. “X” Each axis should always be labeled and include the proper units.
Graph Basics • Lines • The general equation for a line is:y = mx + b(where y is the dependent variable, x is the independent variable, m is the slope, and b is the y-intercept) • Slope • The equation for slope is
Slope What is the slope of the line in the graph? Slope (m) = (∆y / ∆x) m = (y2 – y1) / (x2 – x1) First, select two points that are far apart Plug values into the equation:m = (30 – 10) / (14 – 4)m = 2 So, the slope is 2, but what are the units, and what do they mean? In this case, the units would be (smiley faces / puppies) or /p And this tells us that you would get 2 smiley faces for every puppy you see!
Graphs • What is the y-intercept of the graph and what does that mean? • The y-intercept is 2 and it means that even with 0 puppies you can have a happiness of 2 • What is the mathematical representation (equation) for our graph?y = mx + b • y = 2x + 2 or H = 2P + 2
Proportional Reasoning • Identifying relationships between variables is crucial in physics. • Two variables are said to be directly proportional when they are each affected in the same way as the other when multiplied by a constant. • For instance, in the equation y = kx , y and x are directly proportional because if you were to double y, x would have to double as well. • Two variables are said to be indirectly proportional when one variable is affected inversely when the other is multiplied by a constant. • For instance, in the equation y = 1/x , y and x are indirectly proportional because if you were to double x, y would be halved.
Proportional Reasoning Two variables are said to be directly related when one variable increasing causes the other to increase as well. Two variables are indirectly (inversely) related when one variable increasing causes the other to decrease.