The Tortoise and the Hare: A Study of Speed and Motion in Graphical Form
180 likes | 809 Vues
Explore the classic fable of The Tortoise and the Hare through the lenses of physics and mathematics. This interactive lesson analyzes the race using position-time and velocity-time graphs to understand speed, average speed, and instantaneous speed. Students will collaborate to describe the race dynamics, addressing key questions about speed measurements (m/s, m·s^2) and defining what constitutes “faster.” Engage with the concepts of motion, acceleration, and the relationship between distance and time in this enlightening group work activity.

The Tortoise and the Hare: A Study of Speed and Motion in Graphical Form
E N D
Presentation Transcript
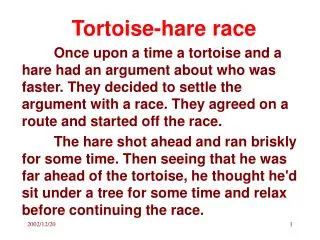
The Tortoise and the Hare Told in words, formulas, and graphs
CPS Question Who was fastest? • The tortoise. • The hare. • They had the same speed. • What do you mean by faster?
Group Work Describe the Tortoise-and-hare race using a position-time graph.
CPS Question Who had the fastest average speed? The tortoise. The hare. Their average speeds were the same. Over what time interval?
CPS Question What are the units for speed? m. s. m·s. m/s. m/s2.
CPS Question Who had the fastest maximum instantaneous speed? The tortoise. The hare. Their instantaneousspeeds were the same.
Group Work Describe the Tortoise-and-hare race using a velocity-time graph.
hare tortoise Speeds and Areas speed area = distance t1 t2 t3 time
Smoother Motion x-t plot motion diagram Young and Freedman, Fig. 2.8 Can we make a v-t plot of this process?
Visualize Acceleration Young and Freedman, Fig. 2.8 Group Work: Signs of v Signs of a