Download
1 / 8
80 likes | 198 Vues
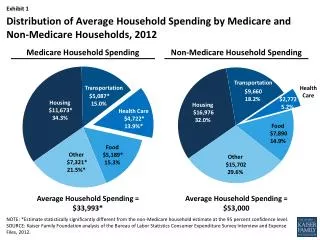
Medicare Spending per Beneficiary Hospital Compare Release April, 2012 . AAMC Contacts : Jennifer Faerberg jfaerberg@aamc.org 202-862-6221. Background.

E N D
Medicare Spending per BeneficiaryHospital Compare Release April, 2012 AAMC Contacts: Jennifer Faerberg jfaerberg@aamc.org 202-862-6221
Background • The Affordable Care Act (ACA) states the Secretary must ensure that efficiency measures are included in a hospital value-based purchasing program • The statutory language requires the use of Medicare Spending per Beneficiary measures (MSPB) • CMS proposed to include the MSPB measure in VBP for FY2014, but has delayed implementation • Once the measure is implemented it will be the singular measure in the efficiency domain
Determining Spending Amount • Based on episodes of care 3 days prior to admission through 30 days post discharge • Includes all part A and B services (including outlier payments) • Utilizes Medicare Advantage risk-adjustment which adjusts for age and co-morbid conditions (HCCs) • Uses standardized pricing • Scores are calculated based on a hospitals’ average spending across all eligible episodes compared to the national median
Exclusions • IME and DSH payments • Transfers between acute care hospitals • Patients who died during episode • Statistical outliers
Determining the Spending Ratio • Each hospital’s score is ratio • Ratios are calculated based on a hospitals’ average spending across all eligible episodes compared to the national median • Interpreting scores: • 1 = Spending is about the same as the national median • >1 = Spending is MORE than the national median • < 1 = Spending is LESS than the national median
National Distribution Medicare Spending Per Beneficiary – All HospitalsDischarges May 2010-February 2011 Min 0.32 0.7 0.8 0.9 1 1.1 1.2 1.3 Max 2.07 LOWER spend per patient compared to national median HIGHER spend per patient compared to national median • Note: N = 3,374 hospitals. Source: AAMC analysis of Hospital Compare and AAMC member data - April 2012.
COTH Spend Slightly Higher COTH Non-COTH Min 0.7 0.8 0.9 1 1.1 1.2 1.3 Max Max 2.07 Min 0.7 0.8 0.9 1 1.1 1.2 1.3 Max Max 2.07 0.75 1.14 0.32 2.07 Ratio Ratio HIGHER spend per patient compared to national median HIGHER spend per patient compared to national median LOWER spend per patient compared to national median LOWER spend per patient compared to national median • Note: COTH members (integrated, independent and specialty) n= 260Source: AAMC analysis of Hospital Compare and AAMC member data - April 2012.
Key Takeaways • COTH hospitals range of scores is much tighter than the spread for hospitals nationwide • The average spending for COTH hospitals is slightly higher than the national median